The NASDAQ 100 fell on Friday as we continue to grind sideways in general. The 4900 level below continues to be massively supportive, as it was previously
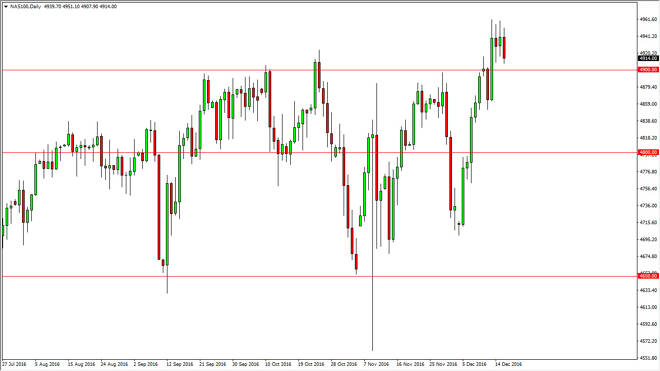
The NASDAQ 100 fell on Friday as we continue to grind sideways in general. The 4900 level below continues to be massively supportive, as it was previously resistive. At this point, if you that the market can continue to go higher, and with this I am waiting for a bounce off of the 4900 level, or perhaps some type of supportive candle in order to go long. I have no interest in selling, and even if we break below the 4900 level, and think there is more than enough support below to cause the market to rise over the longer term anyway.
Chris is a proprietary trader with more than 20 years of experience across various markets, including currencies, indices and commodities. As a senior analyst at FXEmpire since the website’s early days, he offers readers advanced market perspectives to navigate today’s financial landscape with confidence.