



Nvidia Reports Hit Tech Futures Overnight
Futures on the E-mini Nasdaq-100 Index and the E-mini S&P 500 Index are under pressure overnight following a plunge in Nvidia shares on reports the chip company’s board of directors was preparing to oust CEO Jensen Huang. E-mini Dow futures are managing to eke out a small gain.
At 08:11 GMT, the tech-weighted Nasdaq-100 is down 0.83%, while the S&P is off 0.40%. Dow futures are up 0.02%.
The selling is not confined to the U.S. futures market. In Japan, the Nikkei 225 was down 0.82%, while South Korea’s benchmark index dropped 1.26%. Hong Kong was down 0.82%. China’s CSI 300 lost 0.19% and Australia’s S&P/ASX 200 finished 0.07% lower.
South Korea’s Kospi suffered the biggest loss, with Samsung and SK Hynix—both key Nvidia suppliers—among the stocks under pressure.
Board Reports Renew Selling Pressure
Nvidia rebounded on Wednesday after starting the week under pressure, but the selling resumed during the U.S. extended trading session after The New York Times reported that Huang had a second extramarital relationship with an executive at the chip giant. Meanwhile, The Wall Street Journal reported that Nvidia’s board was poised to unseat Huang from his post. Currently, shares of Nvidia are down about 8.95%.
Nvidia Tests a Key Weekly Support Zone
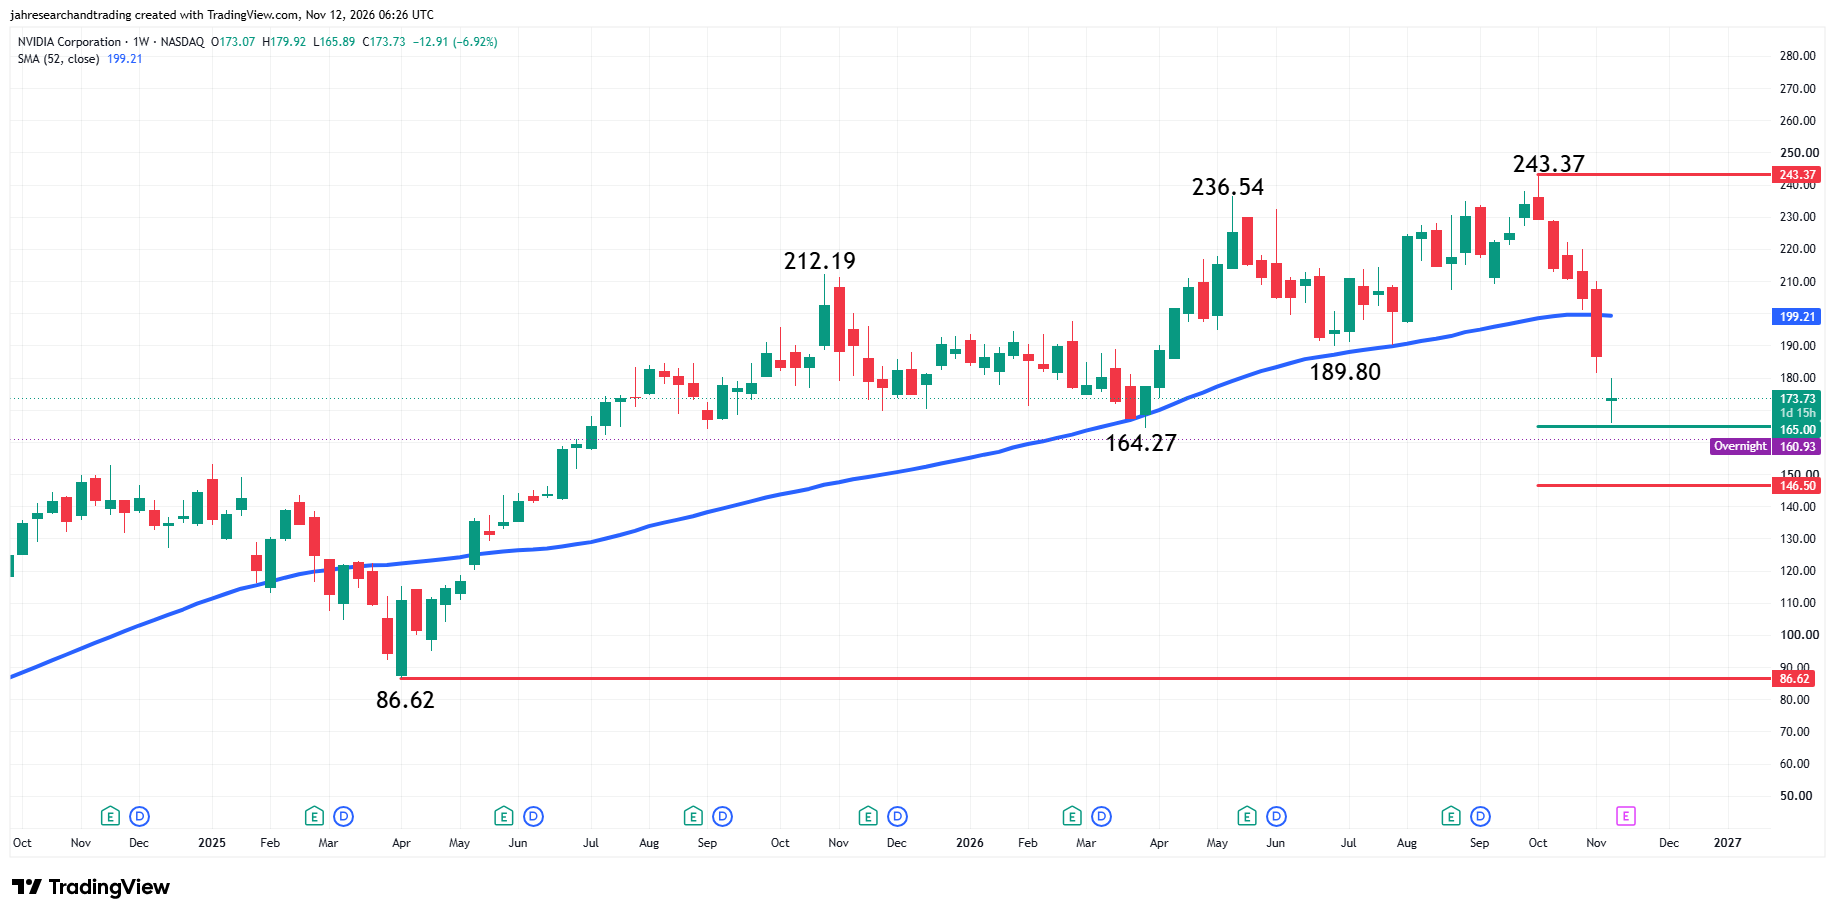
Technically, Nvidia is in a downtrend on the weekly chart. On Monday, the main trend turned down on the weekly swing chart when sellers took out the main bottom at $189.80. The downside momentum was driven by a breakdown under the 52-week moving average at $199.21, which is now resistance.
NASDAQ 100 Price Forecast
Every new NASDAQ 100 analysis as it publishes, today's technical signal and key levels, live price — on one page.
See all NASDAQ 100 forecastsThe long-term range is defined by the April 2025 bottom at $86.62 and the October 2026 top at $243.37. This range has formed a 50% to 61.8% retracement zone at $165.00 to $146.50. Currently, Nvidia is trading inside this area, so a technical bounce is possible if value buyers decide to step in to support the stock. However, the strong downside momentum and the bearish developments overnight suggest the selling pressure may extend beyond this potential support zone. The price action and order flow on a test of this area will be key before trying to call a bottom.
Daily December E-mini Nasdaq-100 Index Futures Technical Analysis
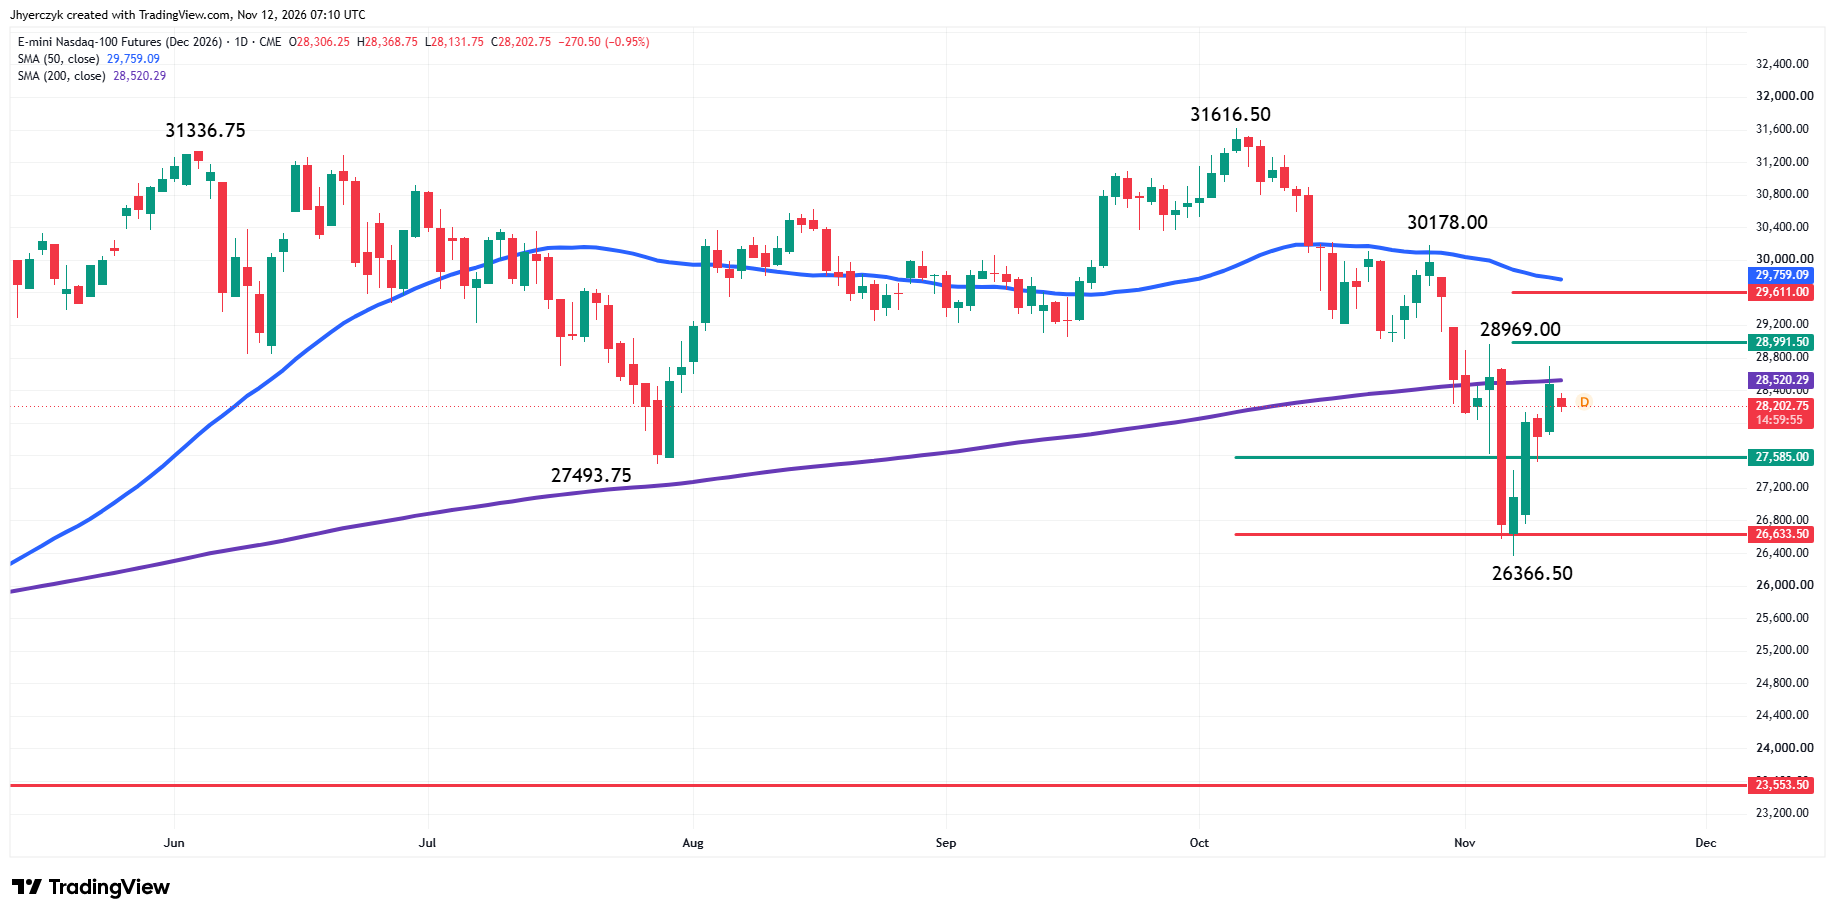
December E-mini Nasdaq-100 Index futures are edging lower overnight after a strong performance the previous session. The main trend is down according to the daily swing chart. A trade through 30178.00 will change the main trend to up. A move through 26366.50 will signal a resumption of the downtrend.
The minor trend is also down. Taking out 28969.00 will change the minor trend to up and could shift momentum to the upside.
The long-term range is 23553.50 to 31616.50. This week’s rally has been driven by a successful test of its retracement zone at 27585.00 to 26633.50. This area remains support.
The intermediate range is 31616.50 to 26366.50. Its retracement zone at 28991.50 to 29611.00 is the next upside target and potential resistance.
On Wednesday, the E-mini Nasdaq-100 Index spent most of the session testing the 200-day moving average at 28520.13. The price action suggests that this indicator is the key to the next major move. A sustained move over the 200-day moving average will indicate the presence of buyers. This move could create the upside momentum needed to challenge the minor top at 28969.00 and the 50% level at 28991.50. Overcoming this area could extend the rally into the 61.8% level at 29611.00 and the 50-day moving average at 29758.54.
Daily December E-mini S&P 500 Index Futures Technical Analysis
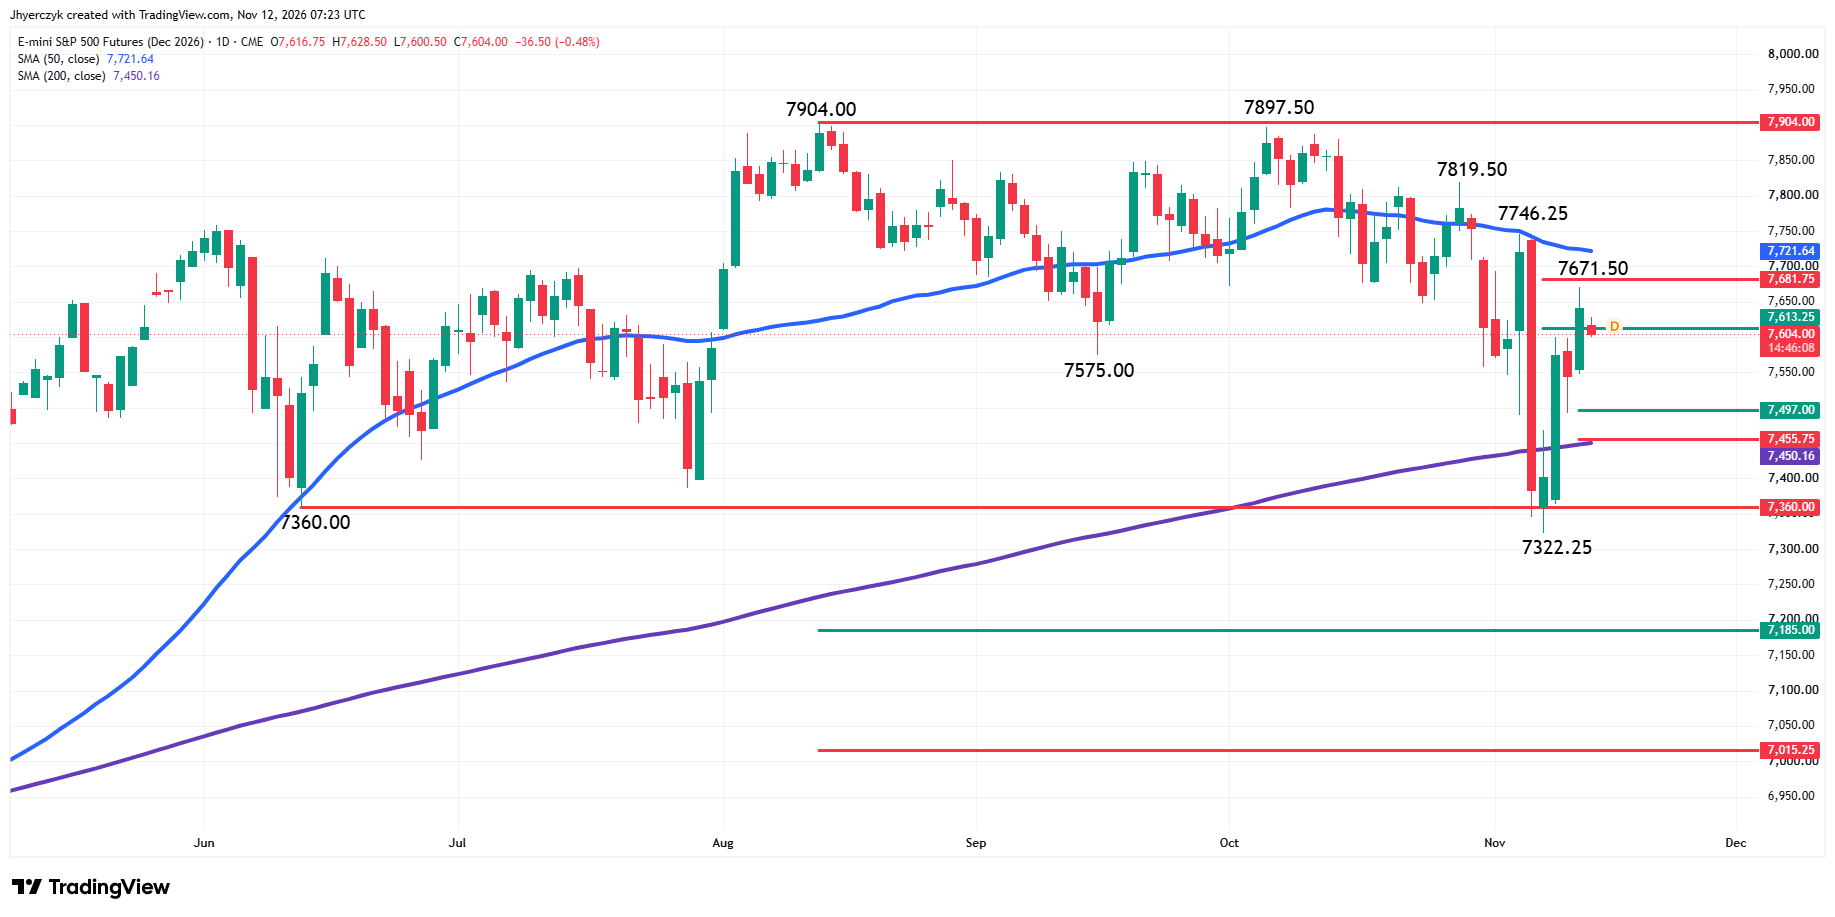
December E-mini S&P 500 Index futures are lower in the pre-market session. The market is posting an inside move. The main trend is down according to the daily swing chart, but momentum has been trending higher following the confirmation of last Friday’s closing price reversal bottom at 7322.25. A trade through this level will signal a resumption of the downtrend. A trade through 7819.50 will change the main trend to up.
The minor trend is also down. Taking out 7746.25 will change the minor trend to up. This could confirm a shift in momentum.
The long-term range is 6466.00 to 7904.00. Its retracement zone at 7185.00 to 7015.25 is support.
The intermediate range is 7904.00 to 7322.25. Its retracement zone at 7613.25 to 7681.75 is the next upside target and potential resistance. The index is testing this area for a second session early Thursday.
The developing short-term range is 7322.25 to 7671.50. Selling pressure today could drive the index into its retracement zone at 7497.00 to 7455.75.
The benchmark index is trading sharply higher this week after breaking above the 200-day moving average at 7450.16, which is now support. It forms a support cluster with the short-term 61.8% level at 7455.75.
The 50-day moving average at 7721.64 is resistance and a potential trigger point for an acceleration to the upside.
What to Watch
December E-mini Nasdaq-100 Index Futures
The downtrend on the trend indicator chart and the inability to overcome the 200-day moving average at 28520.13 has me leaning to the downside before today’s opening. Currently, we’re looking at an inside move, but taking out Wednesday’s low at 27847.75 could create the downside momentum needed to challenge the long-term 50% level at 27585.00. If it fails to hold, then look for the selling to possibly extend into the support cluster formed by the long-term 61.8% level at 26633.50 and the main bottom at 26366.50.
The early price action suggests a headline-driven session could lead to heightened volatility.
December E-mini S&P 500 Index Futures
The main and minor trends remain down, but the breakout over the 200-day moving average at 7450.16 has me leaning to the upside. The key support area is 7455.75 to 7450.16. Holding this cluster should keep the upside bias intact.
The first upside test is the intermediate retracement zone at 7613.25 to 7681.75. Clearing this area, followed by the 50-day moving average at 7721.64, would be a bullish sign. A sustained break under 7450.16 would weaken the outlook and put 7322.25 back in play.
More Information in our Economic Calendar.