


Meta’s Spending Keeps Pressure on Tech
U.S. stocks are under pressure Thursday as traders move back to the part of the AI trade that has been bothering them for weeks: who pays for the build-out and how much risk the credit market is willing to absorb.
The Nasdaq Composite is down 2.1% near the mid-session. The S&P 500 has fallen 1.3%, while the Dow is off about 279 points, or 0.5%.
Meta’s earnings did not solve that problem. The company beat revenue expectations and issued strong guidance, but its shares are down about 5%. Traders heard the growth story. They also heard how much money Meta expects to spend to keep building data-center capacity.
That is the issue holding the technology trade back. AI demand is not disappearing. The market is questioning whether the capital needed to meet that demand is becoming harder to find.
AI Financing Is the Trade
Meta beat on revenue and issued strong guidance. Its shares still fell about 5%. The market is looking at the bill for the next phase of AI, not the quarter Meta just reported.
CoreWeave is part of that bill. Its stock is lower, and the debt market is still uneasy. Meta’s spending plans make it harder for traders to dismiss that as a CoreWeave-only problem.
Demand is there. Nvidia’s Jensen Huang said as much. But he also said capital is scarce. That is the squeeze. Companies can have customers waiting for capacity and still struggle if the money to build it gets harder to line up.
NASDAQ 100 Price Forecast
Every new NASDAQ 100 analysis as it publishes, today's technical signal and key levels, live price — on one page.
See all NASDAQ 100 forecastsOil Adds a Second Risk
Oil is the secondary issue, but it is not helping stocks find a floor. Brent crude futures are up about 3% above $112.45 per barrel. WTI crude futures are higher by about 2% above $99.95 per barrel.
The move followed reports that the United States and Israel could renew strikes against Iran after next month’s U.S. midterm elections. President Donald Trump also said Washington was not negotiating with Tehran and suggested that something could happen soon.
That is enough to put geopolitical risk back into the equity market. Higher oil does not explain the technology selloff, but it makes it harder for buyers to look past the AI financing problem.
Treasury yields are falling as investors move toward safety. The 10-year yield is down more than 9 basis points near 5.048%, while the 2-year yield is also lower. The bond-market response shows that this is not a clean rotation out of technology and into another risk asset. Traders are cutting exposure.
Daily December E-mini S&P 500 Index Futures Technical Analysis
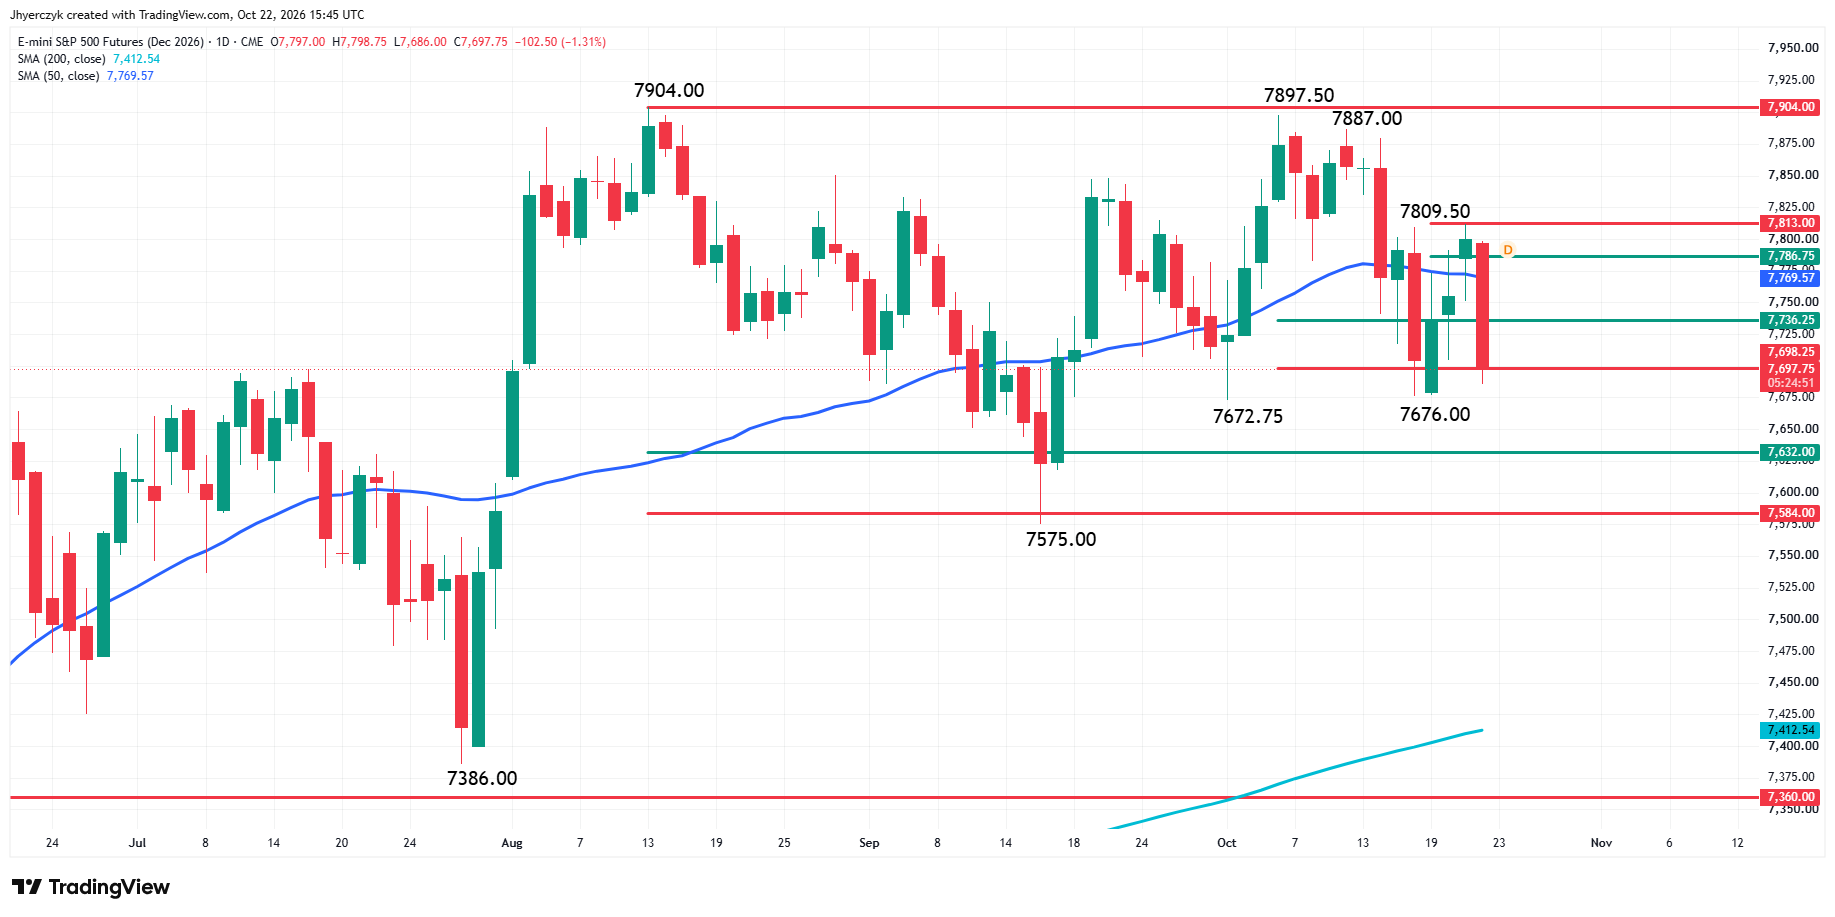
December E-mini S&P 500 Index futures are sharply lower as we near the mid-session after failing to exceed a key retracement area yesterday and crossing to the weak side of the 50-day moving average early Thursday.
The main trend is down according to the daily swing chart. A trade through 7676.00 will signal a resumption of the downtrend. The main trend changes to up on a move through 7887.00. It will be reaffirmed if buyers can take out 7897.50 and the record high at 7904.00.
The minor trend is up. It turned up on Wednesday when buyers took out 7809.50. A trade through 7676.00 will change the minor trend to down.
Swing chart resistance is the retracement zone at 7786.75 to 7813.00. This zone stopped the rally at 7809.50 on Wednesday.
Potential swing chart support at 7736.25 to 7698.25 is currently being tested. Trader reaction to 7736.25 is likely to set the tone today.
Recapturing the 50% level at 7736.25 will indicate the return of buyers. If this creates enough upside momentum then look for the rally to possibly extend into the 50-day moving average at 7770.09, then the retracement zone at 7786.75 to 7813.00.
A sustained move under 7736.25 will signal increasing selling pressure. This could lead to a break into the 61.8% level at 7698.25. If it fails then look for the selling to extend into the two main bottoms at 7676.00 and 7672.75. If these levels fail then look for a test of the intermediate retracement zone at 7632.00 to 7584.00.
Taking out the swing bottom at 7575.00 could trigger a steep break into the 200-day moving average at 7412.54.
Daily December E-mini Nasdaq-100 Index Futures Technical Analysis
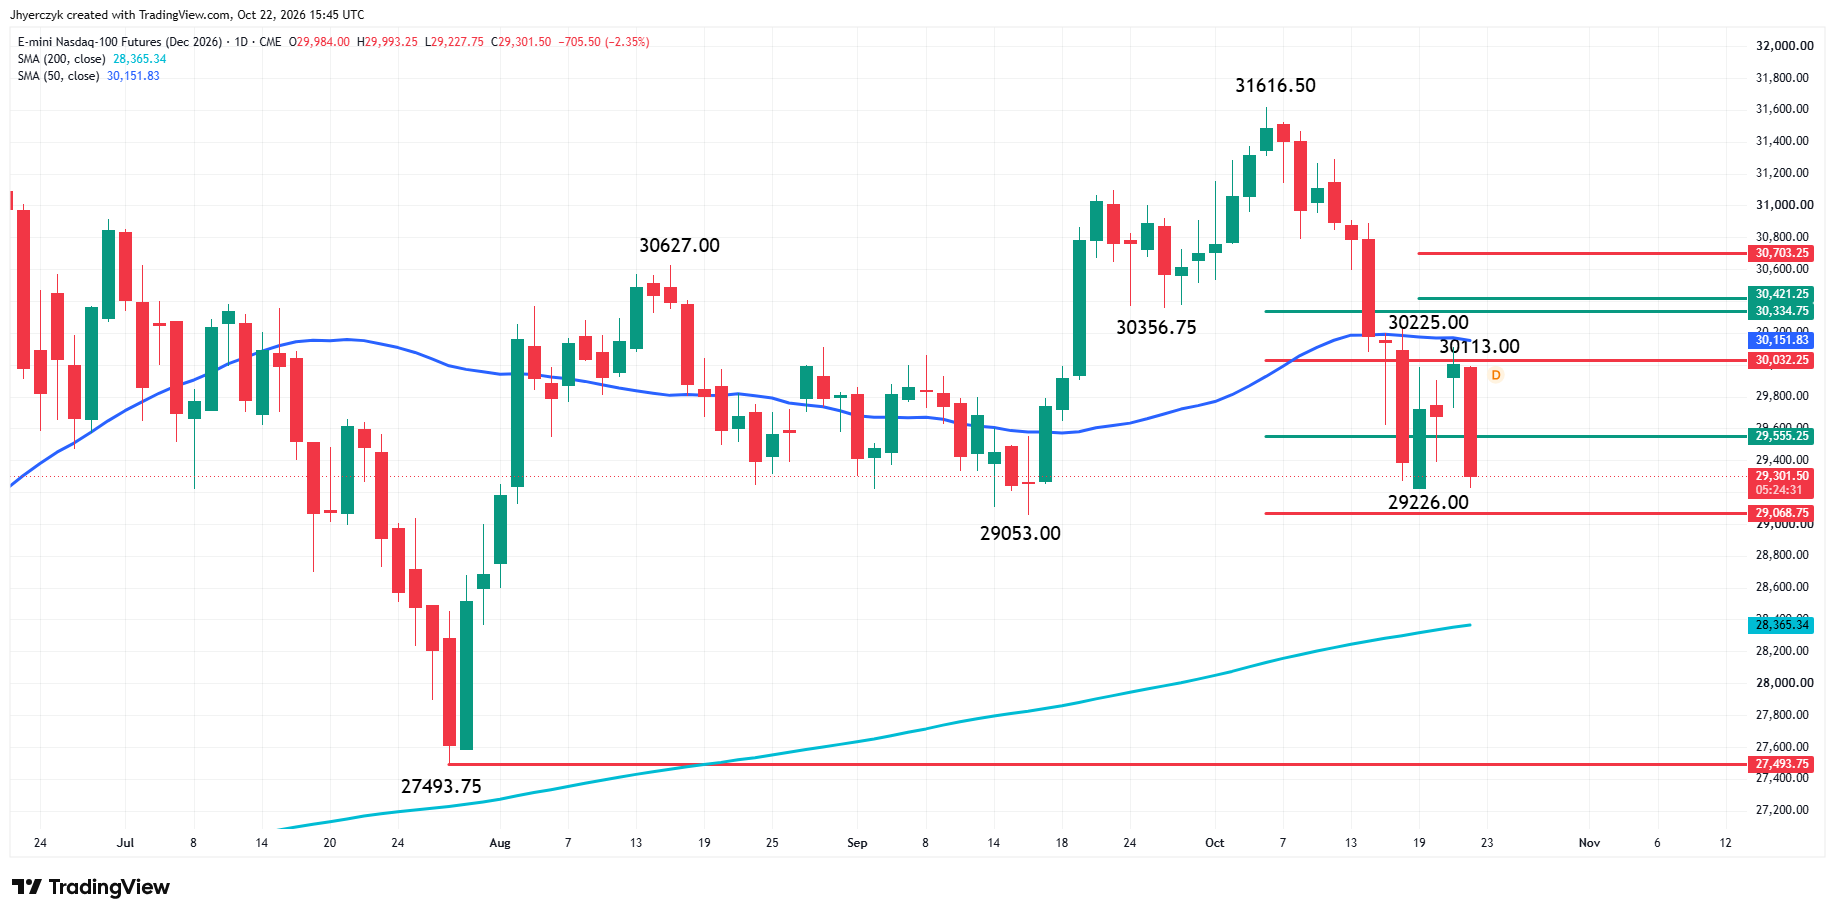
December E-mini Nasdaq-100 Index futures are under pressure as we approach the mid-session on Thursday. The inability to recapture the 50-day moving average at 30154.26 on Wednesday is likely contributing to the weakness.
The main trend is down according to the daily swing chart. A trade through the record high at 31616.50 will change the main trend to up. A trade through the swing bottom at 29226.00 will signal a resumption of the downtrend.
The minor trend is also down. A trade through 30113.00 will change the minor trend to up. Taking out the minor top at 30225.00 will reaffirm the change in the minor trend.
Retracement zone resistance is stacked at 30032.25 to 30334.75 and 30421.25 to 30703.25. The 50-day moving average sits inside the former range, as well as Wednesday’s high at 30113.00.
Retracement zone support is 29555.25 to 29068.75. This zone is currently being tested. On Monday, it provided support at 29226.00. The tone of the market today is likely to be determined by trader reaction to the 50% level at 29555.25.
Recapturing 29555.25 will signal the return of buyers. If this creates enough upside momentum then look for a possible retest of 30032.25 to 30334.75.
A sustained move under 29555.25 will indicate the presence of sellers. If this creates enough downside momentum then look for the selling to possibly extend into the minor bottom at 29226.00, the 61.8% level at 29068.75 and the main bottom at 29053.00. Breaking the main bottom could trigger an acceleration into the 200-day moving average at 28366.11.
What to Watch
The market needs to decide whether Meta’s selloff is a one-day reaction to spending plans or proof that the AI financing issue is growing. If credit concerns continue to spread from CoreWeave, technology buyers are likely to remain cautious even if demand stays strong. Rising oil and fresh Iran headlines are adding to the pressure, but AI financing is still the main trade.
My bias for December E-mini S&P 500 Index futures is bearish. The lower top at 7809.50, the break under the 50-day moving average and the downtrend on the swing chart support the outlook. Recapturing the 50-day moving average at 7770.09 would weaken it.
The downtrend on the swing chart and trade on the weak side of the 50-day moving average support a bearish bias for December E-mini Nasdaq-100 Index futures. A sustained move over 29555.25 would weaken that view.
More Information in our Economic Calendar.