


The Nasdaq Composite and S&P 500 Index are rebounding on Friday with the move supported by aggressive bottom-pickers betting beaten-down stocks will recover from this week’s drubbing.
Data-Center Risk Is Still Driving the Trade
The main catalyst driving this week’s steep sell-off is concerns over a potential slowdown in the construction of data centers. Driving that thought is the Democrats recapturing the House and the Senate in Tuesday’s midterm elections.
States like Texas could also threaten data-center construction after voters elected a new Democratic governor, who is opposed to it.
Beaten-Down Tech Stocks Lead the Rebound
Several beat-up stocks are helping to lift the S&P and the Nasdaq. They include Micron and Nvidia.
Strong Jobs Report Caps the Bounce
Investors are also reacting to an upbeat U.S. labor market report. The government reported early Friday that the economy added 165,000 jobs in October, well above forecasts. The unemployment rate also fell to 4.1%, better than the 4.2% expected. December rate hike expectations jumped on the news, perhaps helping to cap today’s gains.
S&P 500 Price Forecast
Every new S&P 500 analysis as it publishes, today's technical signal and key levels, live price — on one page.
See all S&P 500 forecastsDaily S&P 500 Index (SPX) Technical Analysis
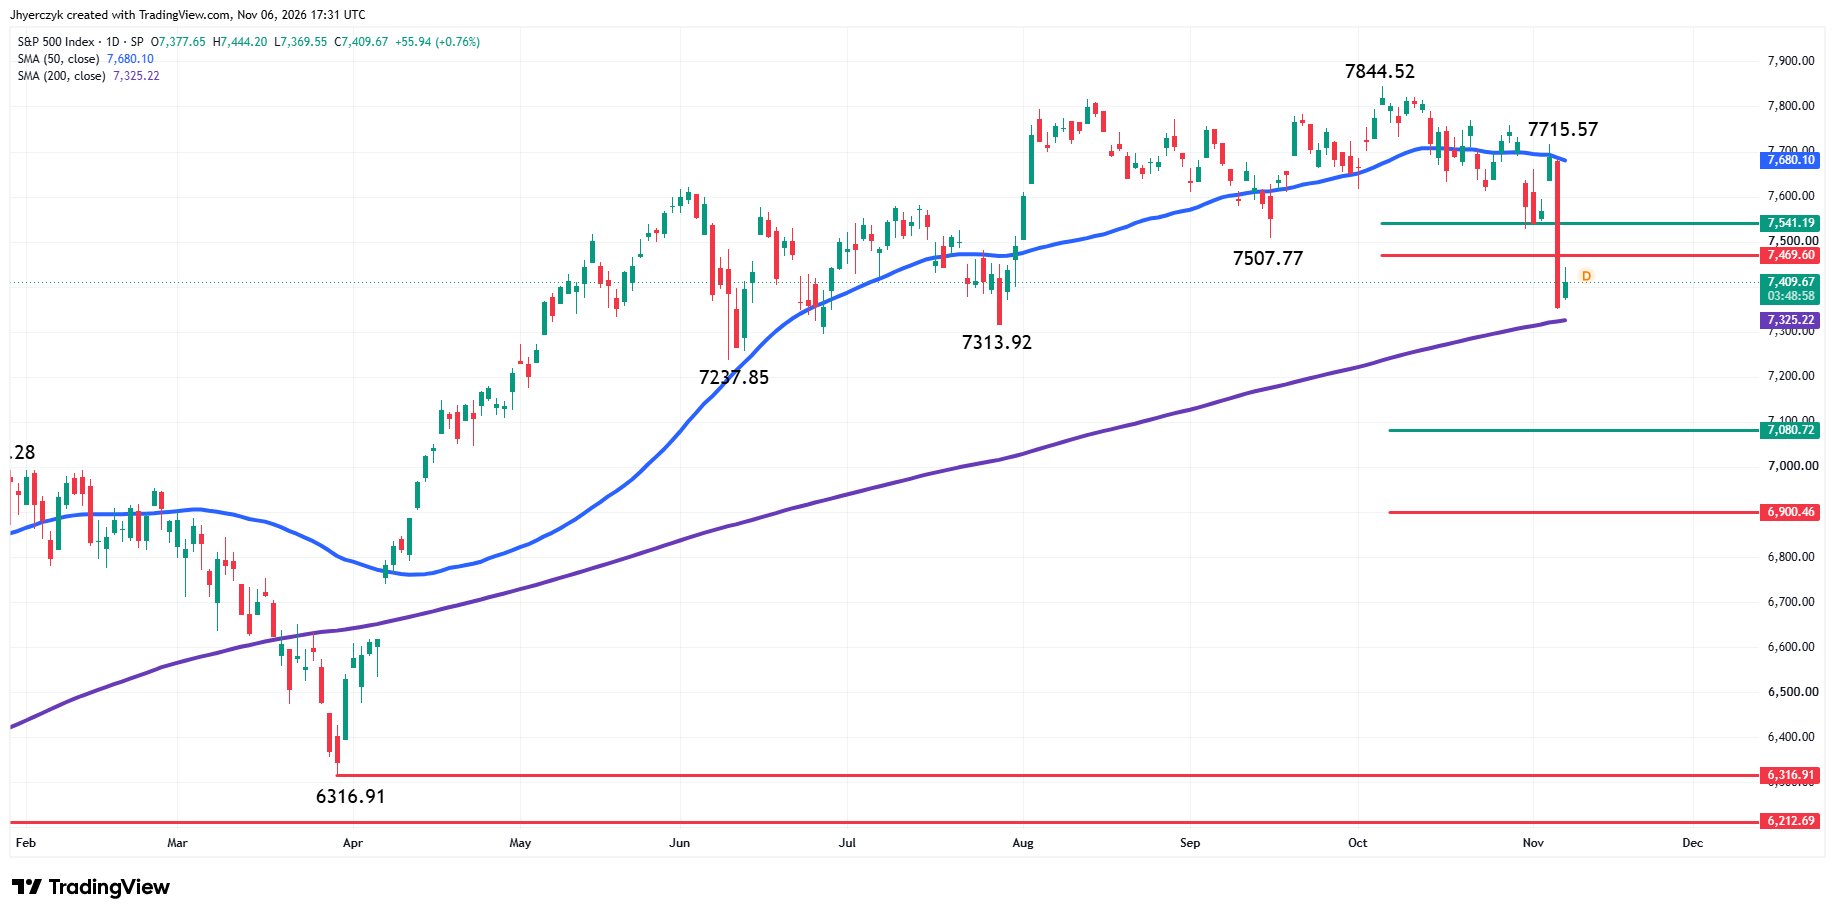
The S&P 500 Index is edging higher at mid-session Friday as traders try to bounce back from yesterday’s steep break. The market is about 1.0% higher and trading inside Thursday’s range.
The main trend is down according to the daily swing chart. A trade through 7350.35 will signal a resumption of the downtrend. Taking out the next two main bottoms at 7313.92 and 7237.85 will reaffirm the downtrend. A trade through 7715.57 will change the main trend to up.
The intermediate range is 7237.85 to 7844.52. Its retracement zone at 7469.60 to 7541.19 is the next upside target and, with the main trend down, potential resistance. The 50% level at 7541.19 is also a potential trigger point for an acceleration to the upside.
The long-term range is 6316.91 to 7844.52. Its retracement zone at 7080.72 to 6900.46 is the next major downside target.
The S&P 500 Index is also trading between the 50-day moving average at 7680.23 and the 200-day moving average at 7325.22. The former can act like resistance and a potential trigger point for a surge into the all-time high at 7844.52. The latter is a potential activation point for an acceleration to the downside, with the target the retracement zone formed by the March bottom and the October top.
Daily Nasdaq Composite Index (IXIC) Technical Analysis
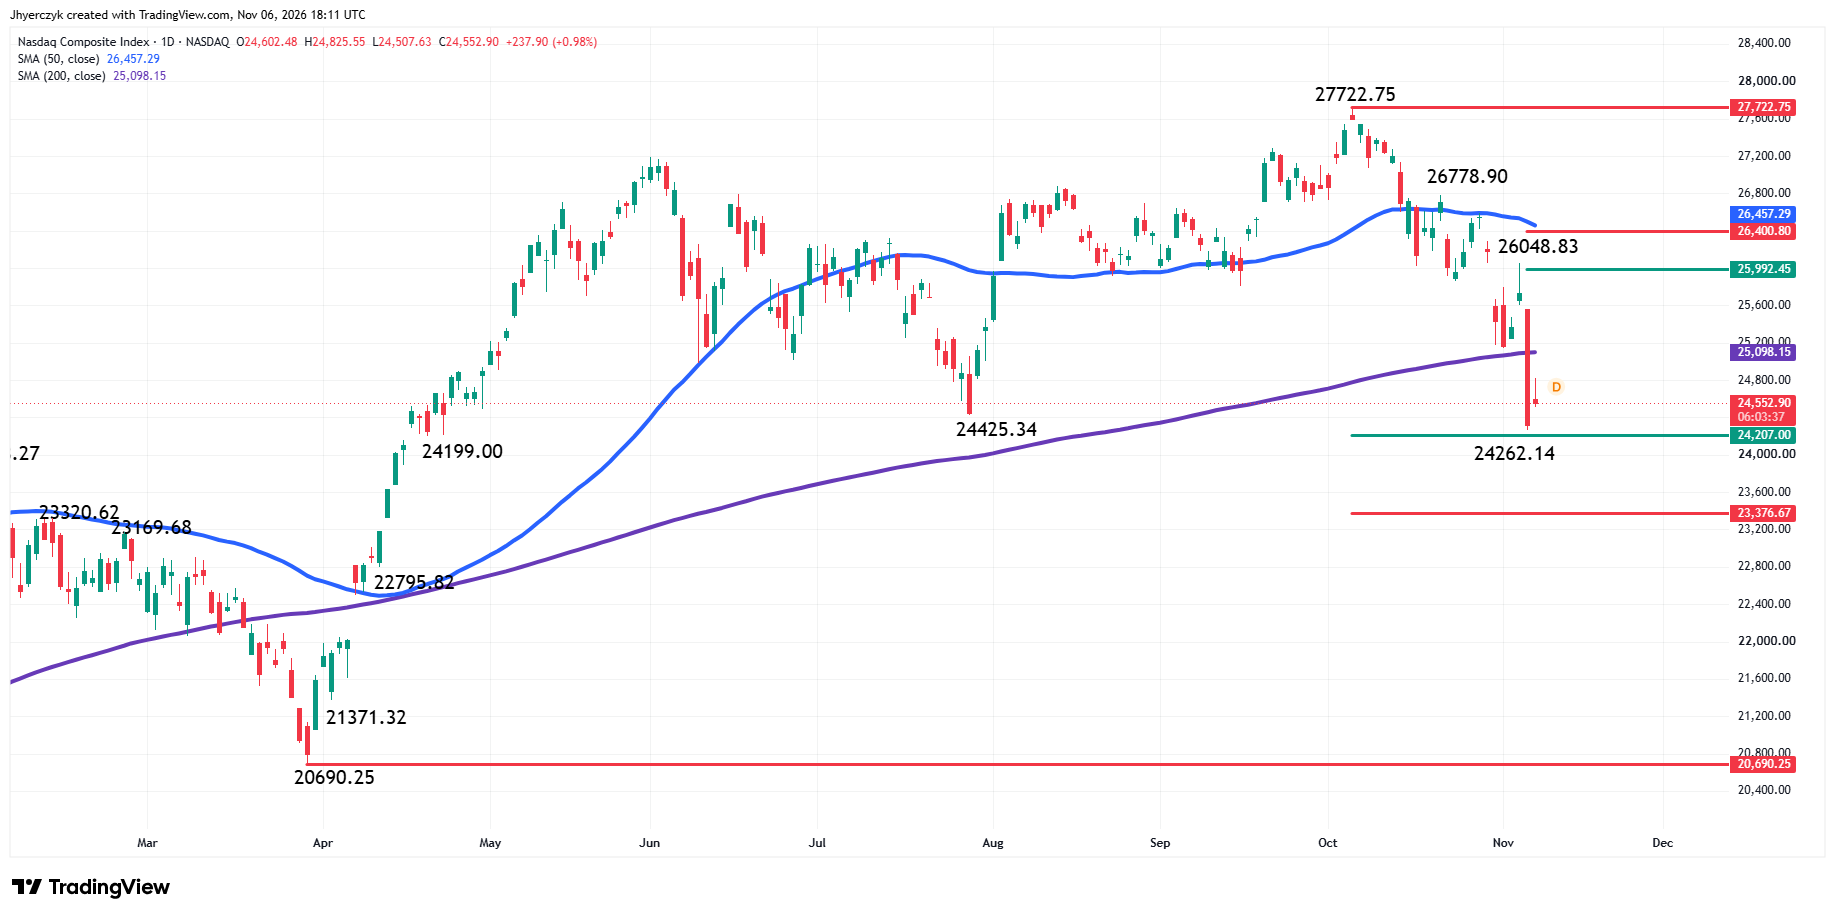
The Nasdaq Composite Index is trading better on Friday. After gapping higher at the opening, the market has been range-bound, suggesting that the early buying was weak and that sellers are in control.
The main trend is down according to the daily swing chart. A trade through the intraday low at 24262.14 will signal a resumption of the downtrend. Taking out the main bottom at 24199.00 will reaffirm the downtrend.
The short-term range is 27722.75 to 24262.14. Its working retracement zone is 25992.45 to 26400.80. This zone will move lower if 24262.14 is taken out.
The intermediate range is 20690.25 to 27722.75. Its retracement zone at 24207.00 to 23376.67 is the next downside target.
The index is trading under the 200-day moving average at 25098.15, putting it in a bearish position. This is also resistance. The 50-day moving average drops in at 26457.29.
What to Watch
S&P 500 Index (SPX)
With the main trend down and the market below the more active 50-day moving average, my bias is to the downside. The market is currently in a position to take out the 200-day moving average. If sellers hit it with the same vigor as Thursday’s steep selloff, the market could hit the retracement zone at 7080.72 to 6900.46 in quick fashion.
Holding the 200-day moving average and rallying back over the intermediate 61.8% level at 7469.60 will weaken my outlook for another sharp break. Overtaking the 50% level at 7541.19 will force me to rethink my bearish position because it will put the index in a position to challenge the 50-day moving average.
Nasdaq Composite (IXIC)
My bias is to the downside with my eye on the retracement zone at 24207.00 to 23376.67. Watch for a technical bounce on the first test of this area, but if it fails then look for a possible acceleration to the downside with the March 30 bottom at 20690.25 the next major target.
Holding above the 50% level at 24207.00 after a successful test of the major retracement zone will weaken my bearish outlook. If this move gains traction and the market overtakes the 200-day moving average at 25098.15 then I may be forced to abandon the short side until I see how the market reacts at the short-term retracement zone at 25992.45 to 26400.80 and the 50-day moving average at 26457.29.
More Information in our Economic Calendar.