


NASDAQ 100 Technical Analysis
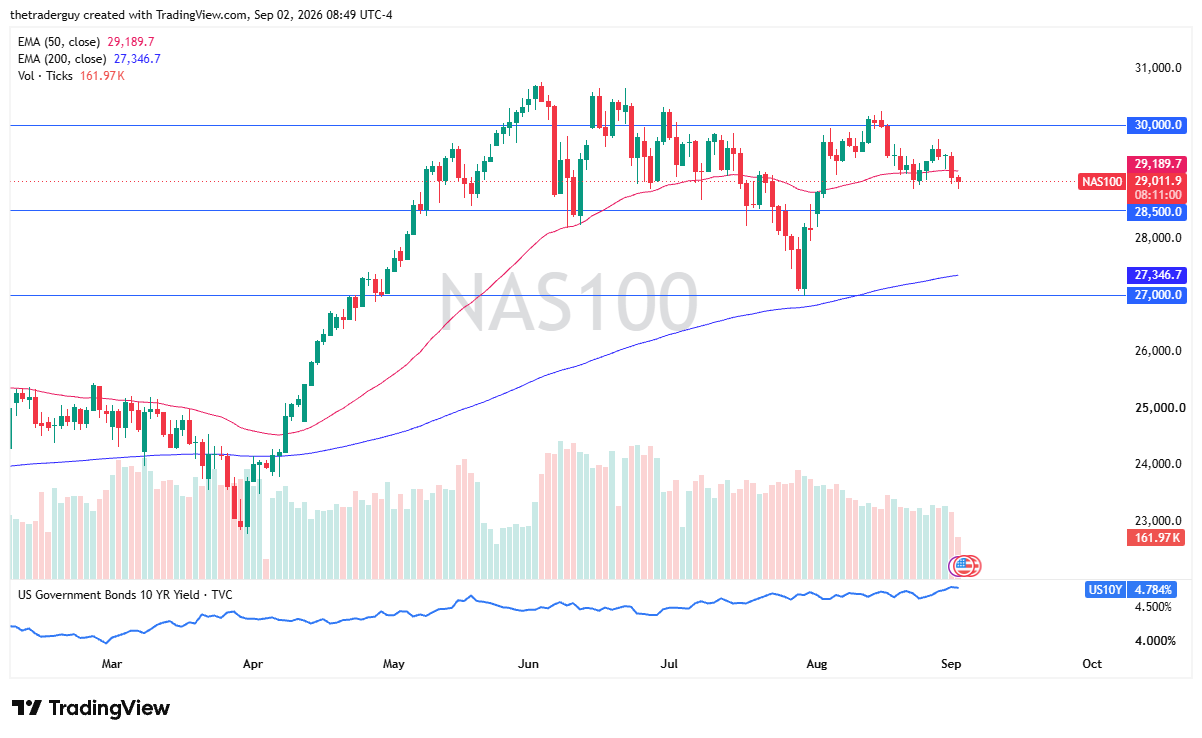
The Nasdaq 100 is slightly negative in premarket trading, which is not a huge surprise considering how elevated interest rates are right now in the United States. But we do have the jobs number on Friday, and I think that will be the big tell.
The reality is that Kevin Warsh basically made it plain that he’s not looking to cut, and in fact could raise rates. A hot jobs number might be one of those situations where good news is bad news. Right now, rangebound. We’re still in the same range we’ve been in.
Dow Jones 30 Technical Analysis
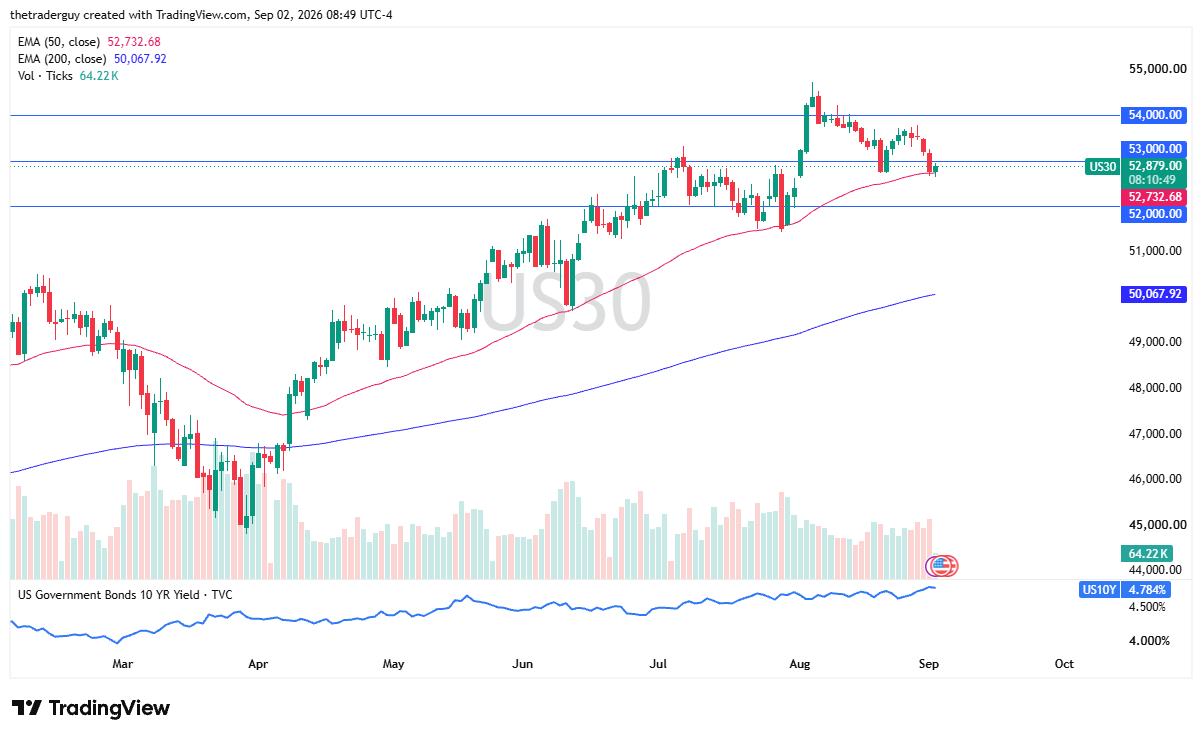
The Dow Jones 30 has risen slightly during premarket trading from the 50-day EMA. This index is one that is basically testing the bottom of a channel, and it looks like it is trying to hold that channel. It does make a certain amount of sense that it might try to do so as we have those jobs numbers coming out on Friday, and it will have a major influence on where we go next. With that, a little bit neutral-looking to me at the moment, I would say.
S&P 500 Technical Analysis
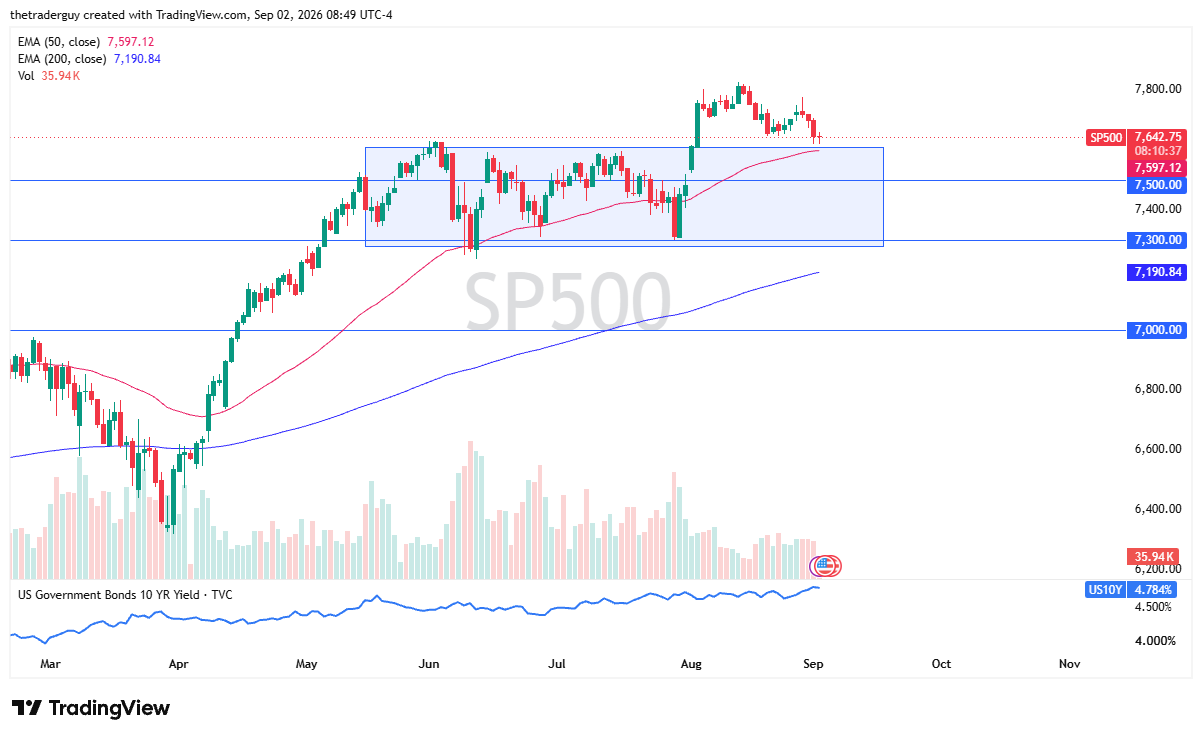
The S&P 500 finds itself sitting just above the crucial 7,600 level. That’s an area that previously had been resistance, so market memory dictates that it could be support. We’re also sitting just above the 50-day EMA, so that’s a good sign as well.
This looks like a market that is just floundering at the moment, looking for a reason to get moving, and that jobs report could be it. We’ll just have to wait and see. I suspect many traders out there don’t want to put on a lot of risk before what could be a very, very volatile Friday announcement.
If you’d like to know more about chart patterns and how to trade them, please visit our educational area.