


NASDAQ 100 Technical Analysis
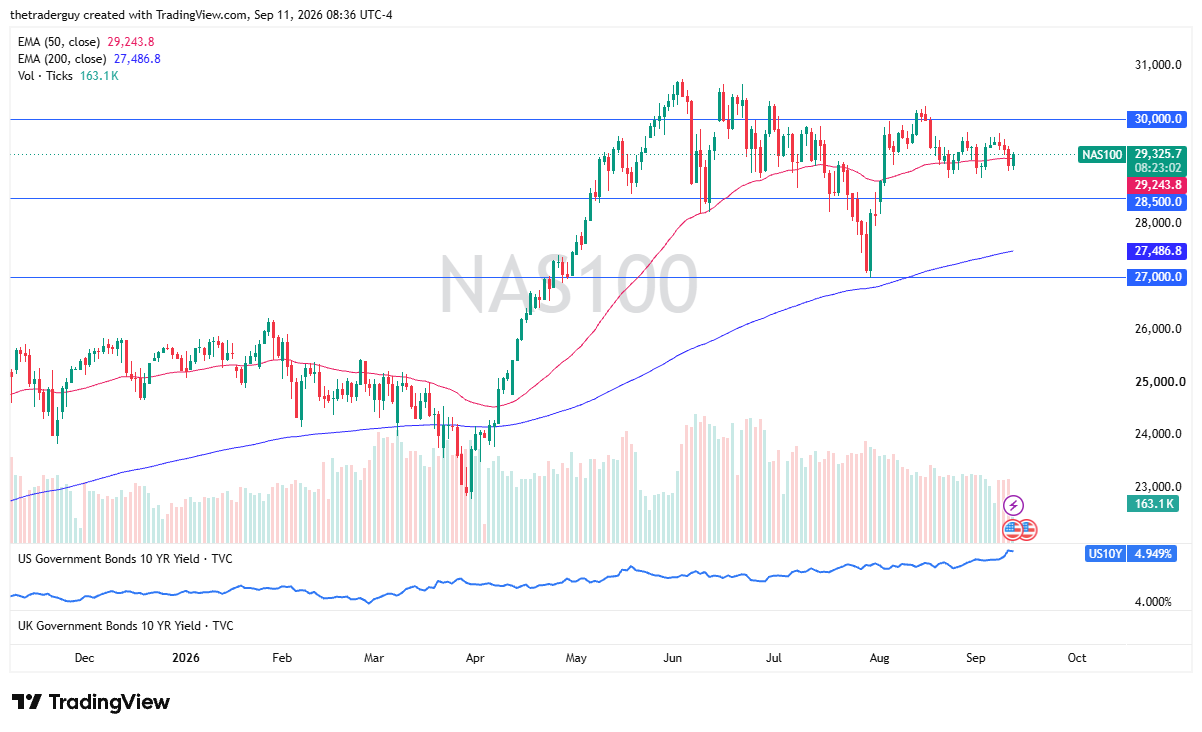
The Nasdaq 100 rallied a bit in early trading on Friday as traders contemplate the hotter-than-anticipated month-over-month core CPI number. During the session, one of the biggest drivers of price action might have been the fact that oil fell. Oil was starting to spike somewhat out of control, and higher oil prices are certainly going to be an issue for the economy.
With that, it looks like we have recovered just a bit, maybe just staying in the same range that we have been in. That would not be overly surprising at this point. Ultimately, this is a market that is hugging the 50-day EMA.
Dow Jones 30 Technical Analysis
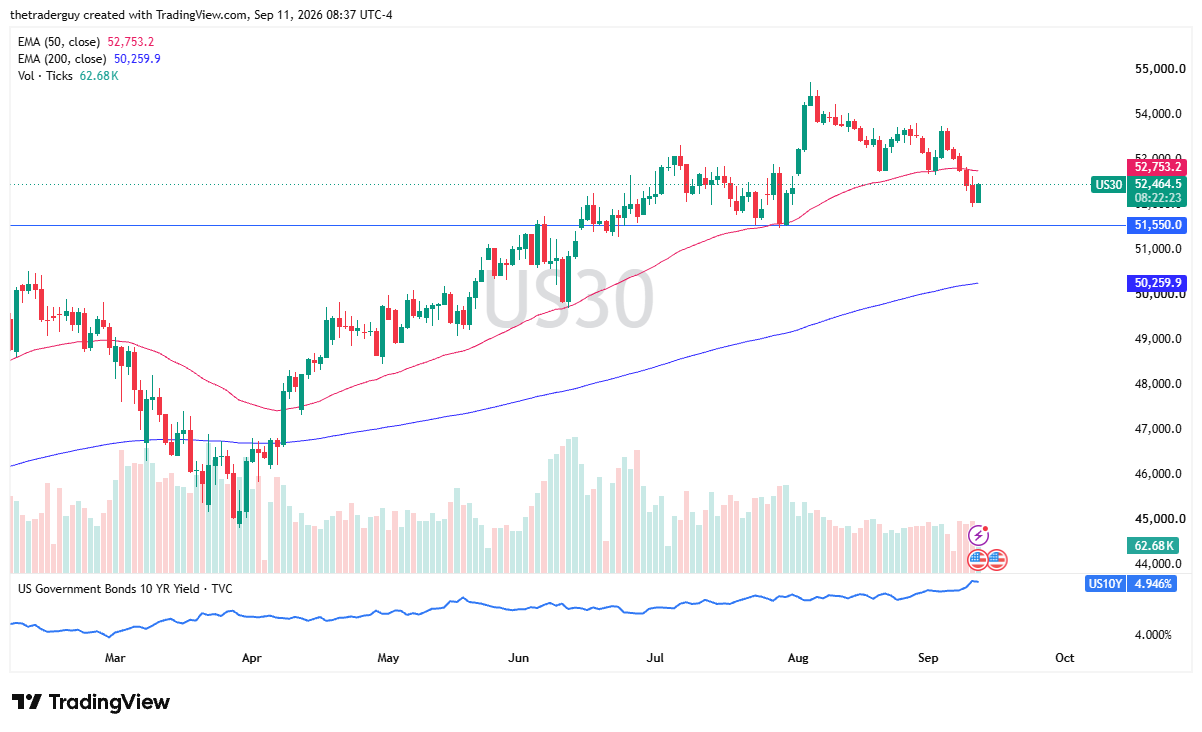
The Dow Jones 30 has done quite well during the early part of the session as well, and it does look like it is going to try to bounce toward the 50-day EMA. Whether or not it gets there remains to be seen, but I will be looking at this as a positive sign. Markets are willing to look past the 0.3% month-over-month core CPI number and focus on the fact that energy is dropping.
That does make a certain amount of sense, as it would help industrials here in the Dow Jones 30. Of course, the 51,550 level remains support.
S&P 500 Technical Analysis
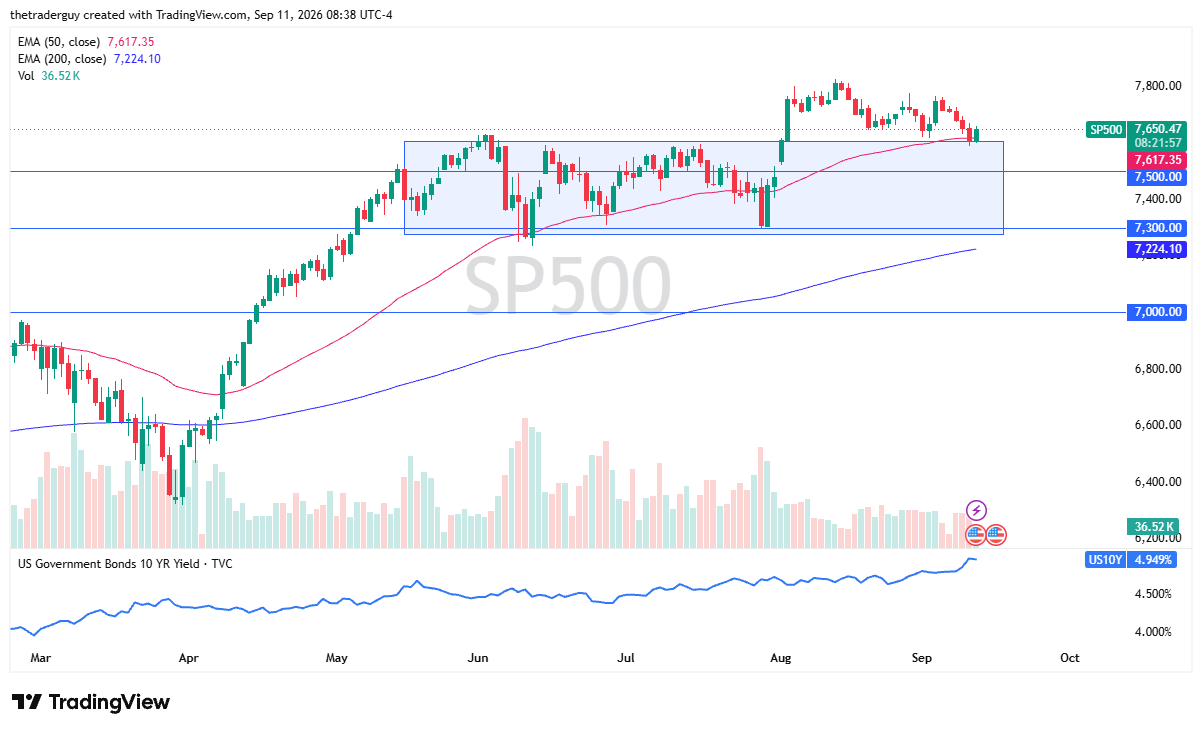
The S&P 500 has bounced from the crucial 7,600 level, which is also where the 50-day EMA currently resides. It is the previous resistance barrier, so market memory finding this level interesting makes a lot of sense to me.
It looks like the consolidation, at least at this point in time, is still trying to hold up. In this environment, that in and of itself is a pretty strong sign, considering that rates are so high in the United States. But it looks like they have completely priced in a Federal Reserve interest rate hike, so maybe the CPI is a non-factor.
S&P 500 Price Forecast
Every new S&P 500 analysis as it publishes, today's technical signal and key levels, live price — on one page.
See all S&P 500 forecastsIf you’d like to know more about chart patterns and how to trade them, please visit our educational area.