


NASDAQ 100 Technical Analysis
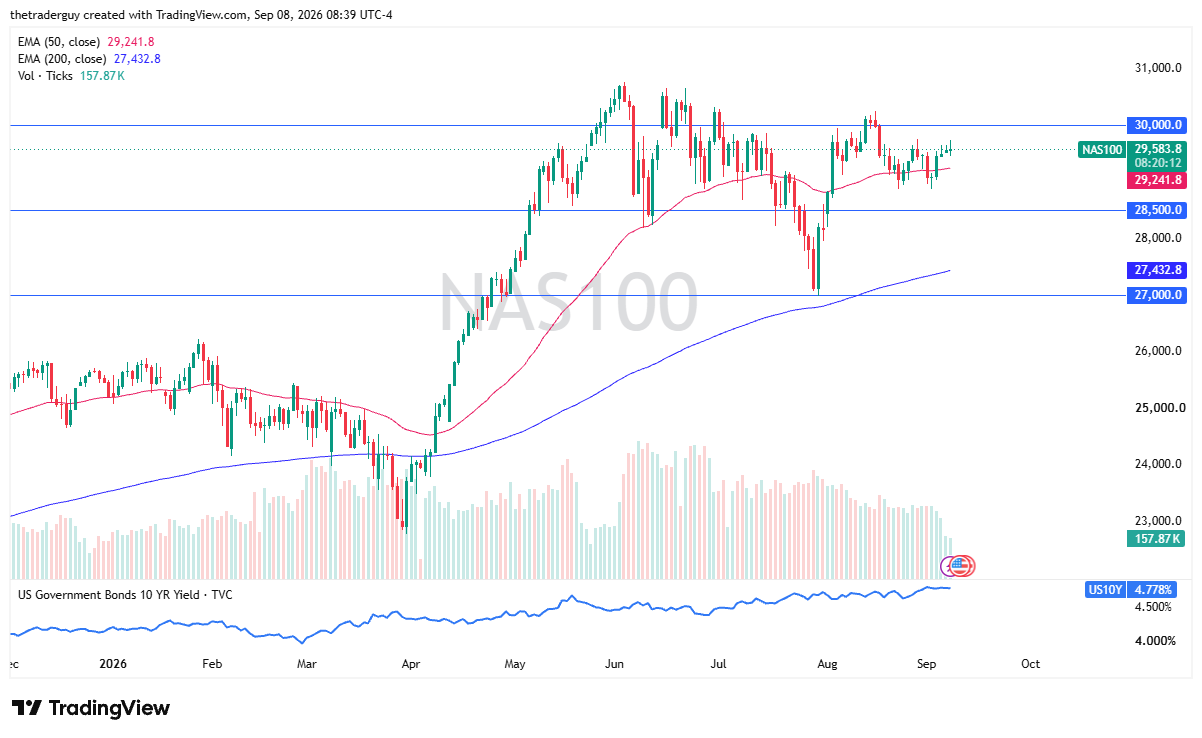
The Nasdaq 100 looks as if it is relatively resilient considering everything that’s going on around the world right now, with the Nasdaq 100 trying to rally early in the day.
It’ll be interesting to see if there’s any type of follow-through as New York comes on. Keep in mind that oil and the inflation risk continue to be a major problem, and the Federal Reserve repricing is out there as well, with the Friday payroll gain of 162,000 versus the roughly 55,000 expected. It has pushed rate hike probabilities toward 60%.
Semiconductors continue to perform well in this index. It looks more or less like sustained upward pressure, but not enough to get overly aggressive.
Dow Jones 30 Technical Analysis
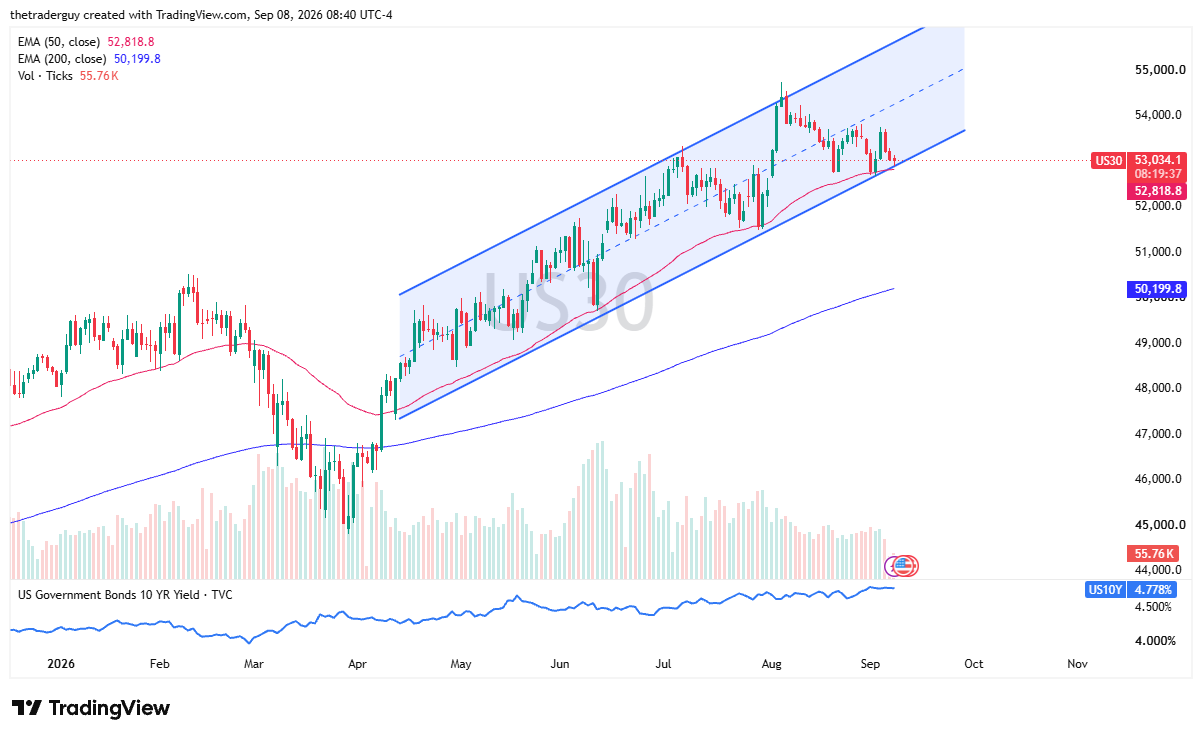
The Dow Jones 30 has shown itself to be somewhat resilient, with the 50-day EMA sitting just below. It’s the laggard of the three, though, not by much.
Right now there are some stocks worth watching. Amgen is down 5% pre-market. Novartis reported disappointing clinical trials, and because Amgen has exposure to a competing cardiovascular treatment, it seems like that’s coming into the picture as well.
This is estimated to be about 120 points of Dow decline, potentially.
The fundamental backdrop, again, is oil inflation expectations. The 10-year Treasury is hovering right around 4.78%. Energy exposure is benefiting in the Dow, so keep that in mind.
S&P 500 Price Forecast
Every new S&P 500 analysis as it publishes, today's technical signal and key levels, live price — on one page.
See all S&P 500 forecastsS&P 500 Technical Analysis
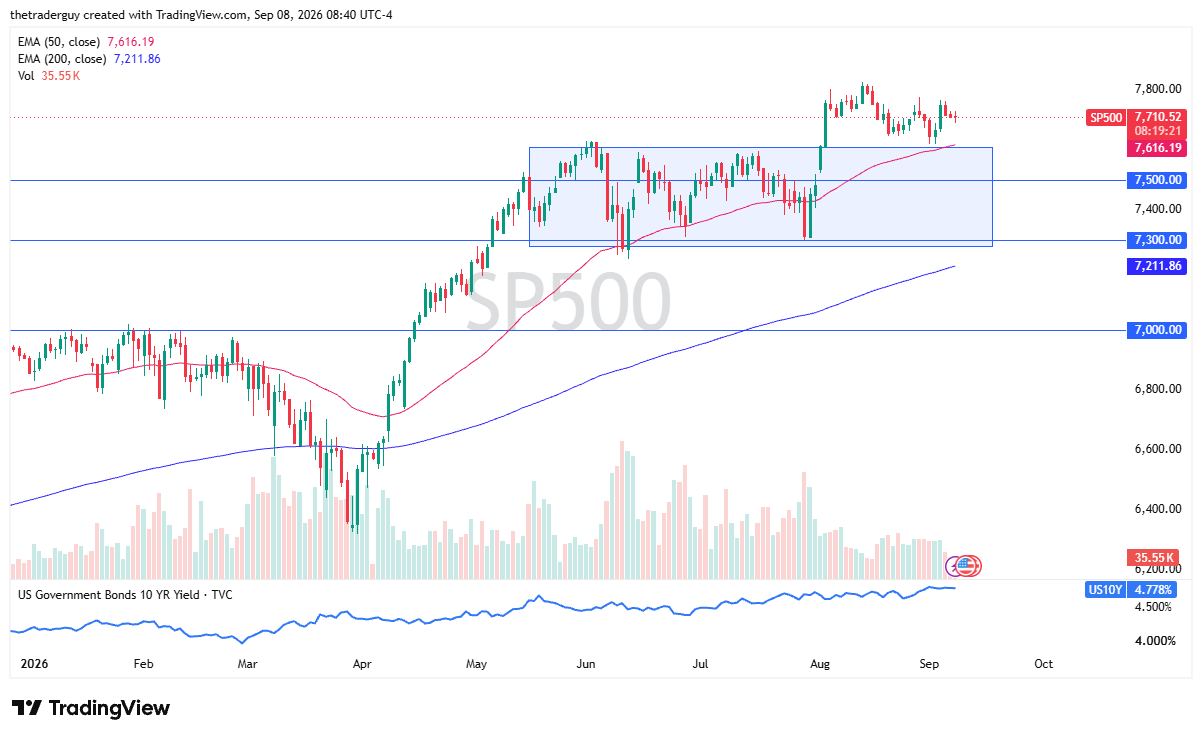
The S&P 500 looks like it’s trying to turn things around after initially dropping a little bit. Right now, the Brent story and Light Sweet Crude, of course, are both influencing this market.
The most important number might be 4.8% because it seems like when we get above there, it causes a little bit of a negative reaction.
7,800 above is significant resistance. The fulcrum price, if you will, the pivot price, seems to be 7,700, so it’s worth watching.
We do have PPI on Thursday and CPI on Friday, and, of course, the Federal Reserve rate decision next week. So, a little bit of choppiness, but it does look like if we can get yields to drop a little bit, the S&P 500 gets a little happier.
If you’d like to know more about technical analysis and how traders use it, please visit our educational area.