



The Nasdaq Composite is plunging late Friday as traders aggressively sold key artificial intelligence-related stocks. The tech-weighted index is down over 3%, putting it on pace to post its worst one-day loss since June.
On Friday, another worry emerged after The Financial Times reported, citing sources, that Blackstone said Anthropic may not receive an investment-grade rating after its IPO. This was on top of earlier pressure from disappointing tech earnings.
The selling started on Thursday after Alphabet shares missed on earnings and revenue in the third quarter, all while reporting negative free cash flow. The selling was relentless enough to produce the company’s largest stock loss on record.
At the end of the month, investors are paying close attention to the spending habits of hyperscalers like Alphabet and Microsoft. This is especially important because the two companies have not raised their capex forecasts. In fact, they actually fell short of analysts’ expectations.
Besides free cash flow and capex spending issues, investors are also being forced to consider debt level issues for cloud-computing companies like CoreWeave and Nebius. The former is down 37% this month and the latter has lost 33%.
I believe those key issues are going to carry over into November. The weak chart patterns on both the weekly and daily charts support this outlook.
Weekly Nasdaq Composite (IXIC) Technical Analysis
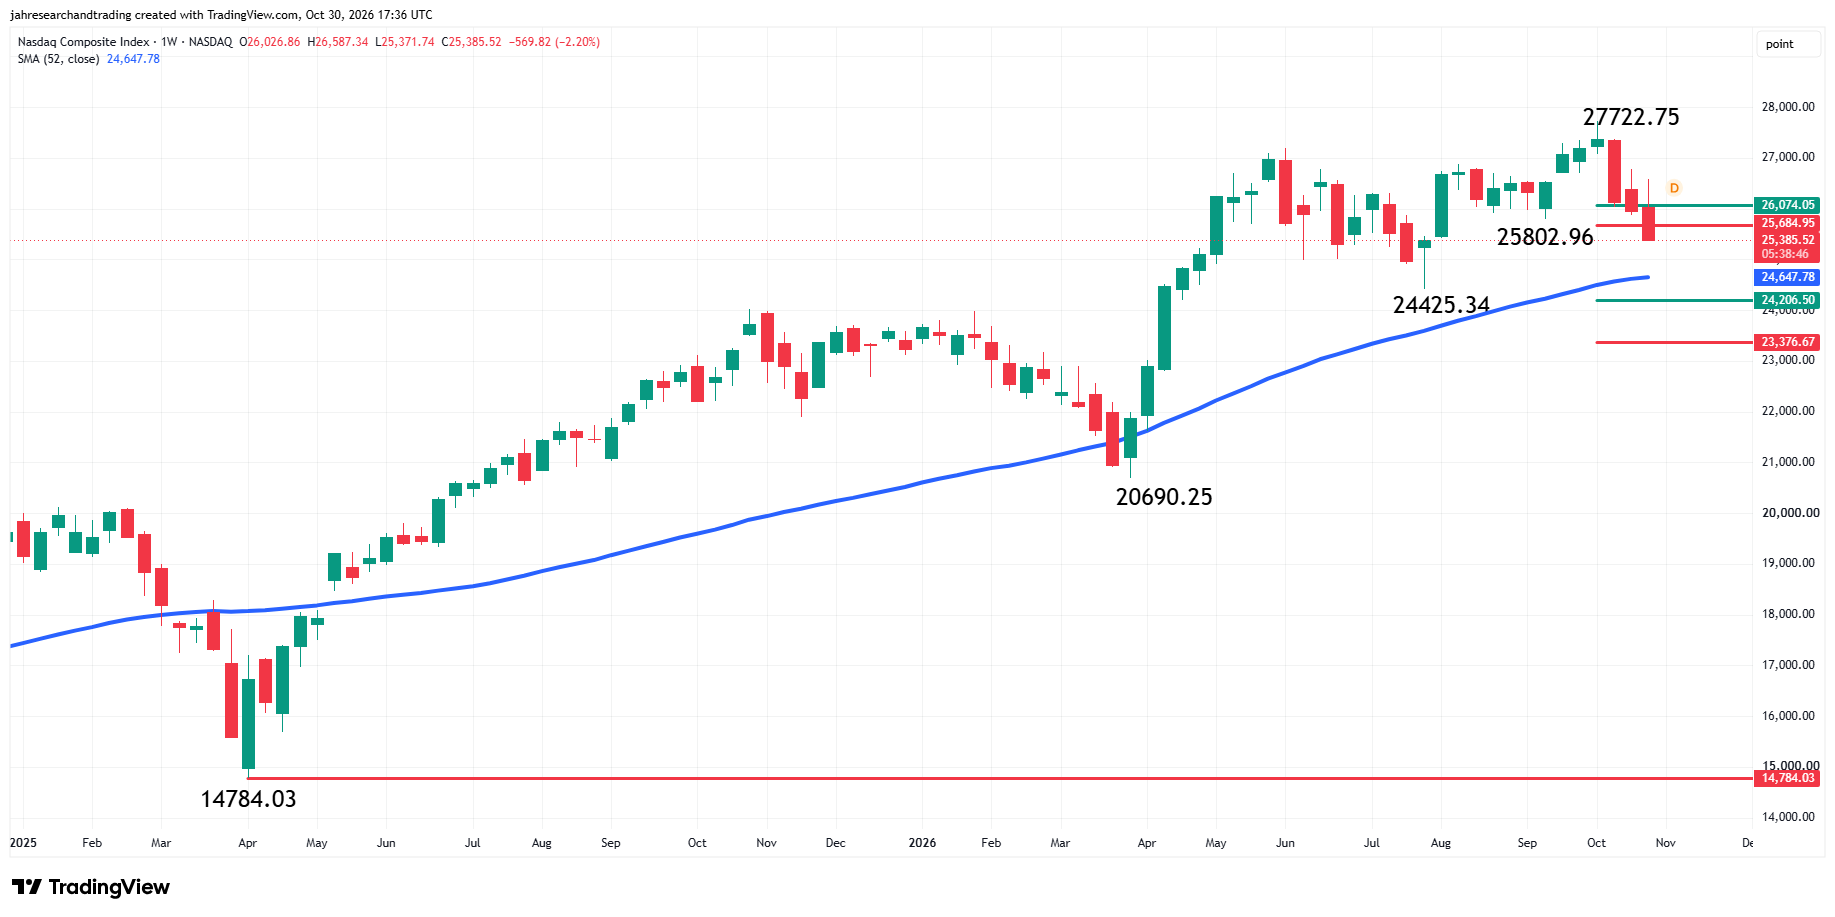
The Nasdaq Composite is lower for the third straight week. The main trend is down according to the weekly swing chart. It turned down when sellers took out the last swing bottom at 25802.96. The main trend will change to up when buyers take out the main top at 27722.75.
The short-term range is 24425.34 to 27722.75. The index is currently trading below its retracement zone at 26074.05 to 25684.95.
The intermediate range is 20690.25 to 27722.75. Its retracement zone at 24206.50 to 23376.67 is the next potential downside target.
The 52-Week Moving Average at 24652.77 could provide support as well as trend guidance.
The change in trend on the main swing chart has shifted my bias to the downside. A sustained move under the 61.8% level at 25684.95 will strengthen my bearish case. This could create the downside momentum needed to challenge the 52-week moving average at 24652.77.
There could be a technical bounce on the first test of the moving average, but if it fails, losses are likely to extend into the intermediate retracement zone at 24206.50 to 23376.67.
My outlook will weaken if the index regains the short-term 50% level at 26074.05.
Dow Jones Price Forecast
Every new Dow Jones analysis as it publishes, today's technical signal and key levels, live price — on one page.
See all Dow Jones forecastsDaily Nasdaq Composite (IXIC) Technical Analysis
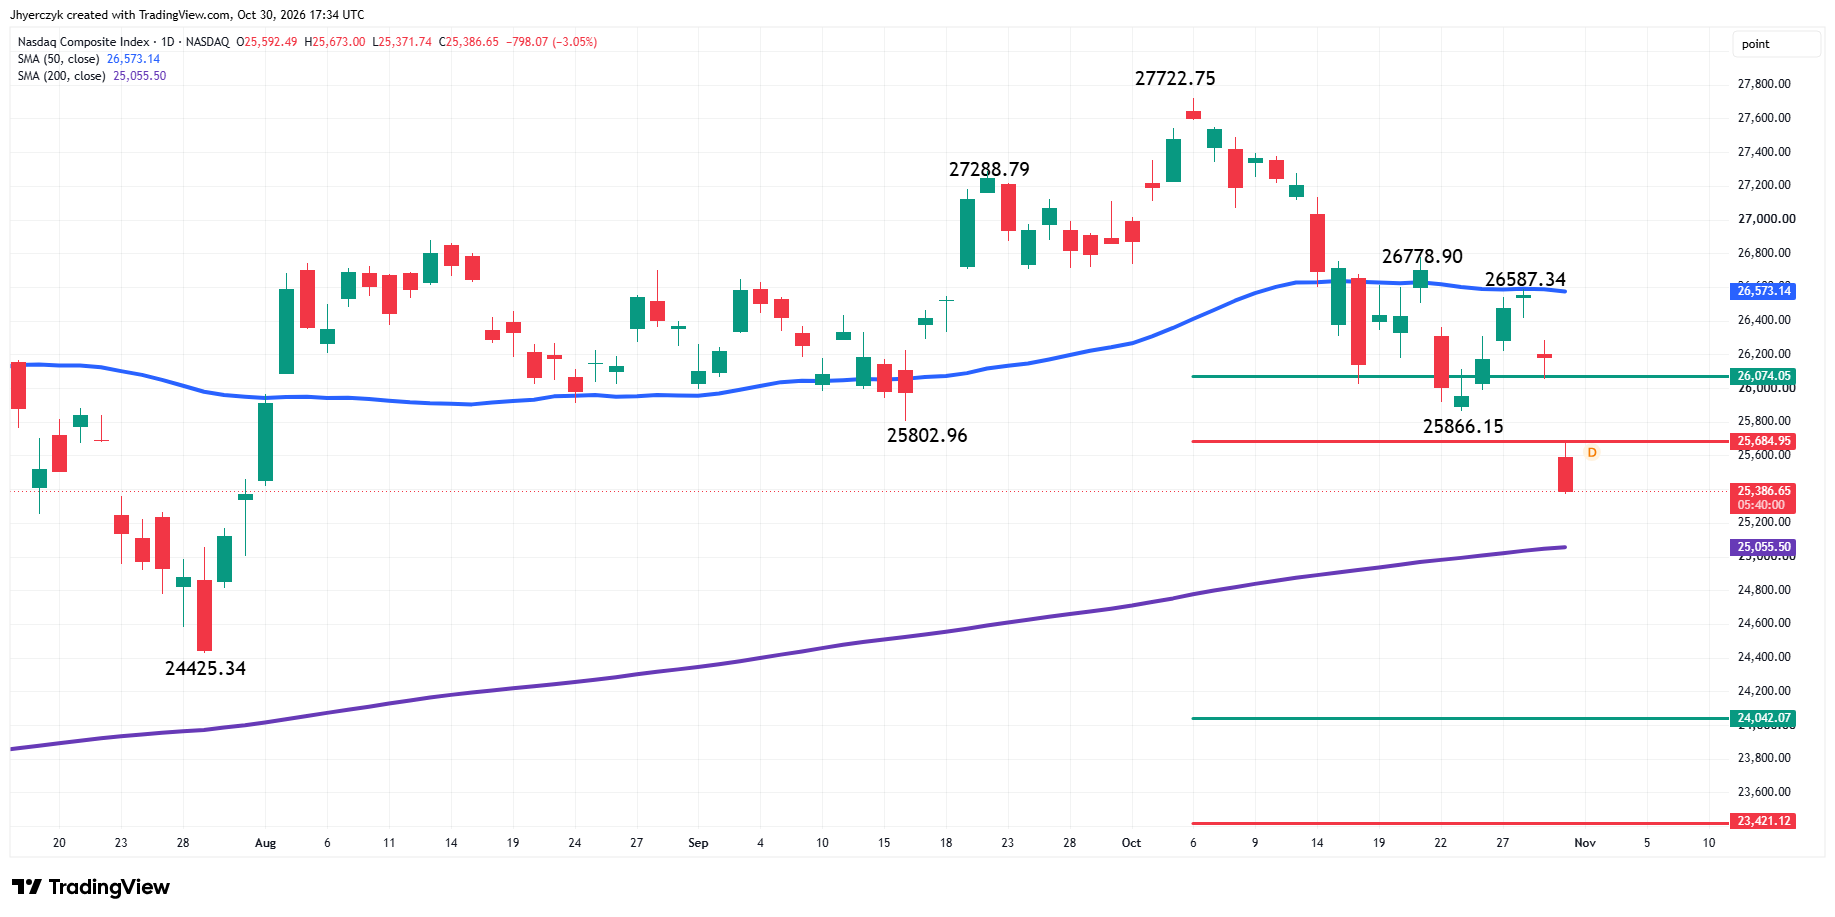
The main trend is down according to the daily swing chart. The downtrend was reaffirmed when sellers took out the swing bottom at 25866.15. A trade through 26587.34 will change the main trend to up.
We’re waiting for a new short-term range to form, but the intermediate-term range is 24425.34 to 27722.75. The index is currently trading on the weak side of its retracement zone at 25684.95 to 26074.05.
The long-term range is 20690.25 to 27722.75. Its retracement zone is 24042.07 to 23421.12. This is a major downside target area.
On the upside, the 50-day moving average at 26573.17 is providing resistance and signaling a downtrend. The 200-day moving average has creeped into the picture at 25055.51.
My bias is to the downside. I have momentum on my side on Friday with the Nasdaq Composite Index on the weak side of the 50-day moving average, downtrending weekly and daily swing charts and crossing to the bearish side of the intermediate retracement zone.
My bias will weaken if buyers can overcome the intermediate 50% level at 26074.05. My outlook will strengthen if the 200-day moving average fails as support.
More Information in our Economic Calendar.