



The Nasdaq Composite Index could be the market to watch next week after a volatile week. Although the index posted a small loss on Friday, it was Thursday’s steep sell-off that rattled investors. Disappointing quarterly reports from Meta and Lam Research led to widespread selling. The major concern that could spread into this week is the state of the AI trade. In general, it is massive hyperscaler spending to build out data centers that has put investors on edge.
This week, the focus will be on three major hyperscalers, Alphabet, Microsoft and Amazon. In addition to that, close to one-third of S&P 500 companies are scheduled to release quarterly reports. The Fed’s interest rate decision on Wednesday could also shake up the trade if the FOMC decides against FedWatch Tool expectations calling for no rate hike in October.
Last week, the Nasdaq Composite Index closed at 25955.34, down 184.69 or -0.71%.
Weekly Nasdaq Composite Index (IXIC) Technical Analysis
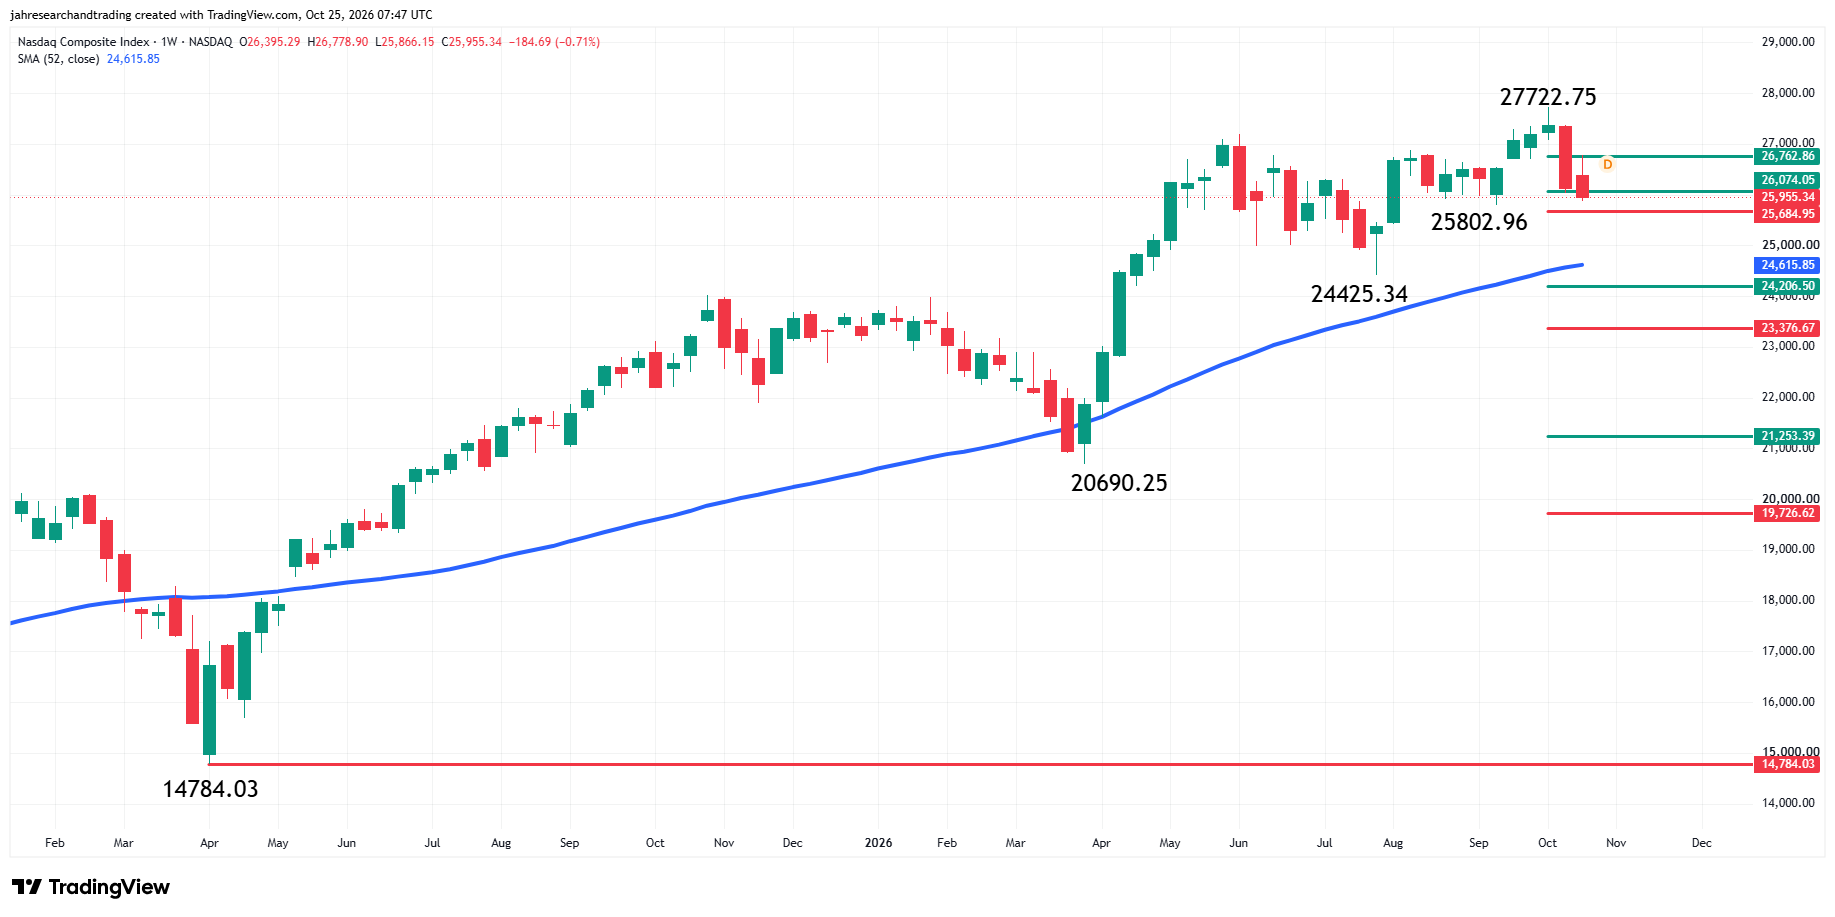
The main trend is up according to the main swing chart. A trade through 25802.96 will change the Nasdaq Composite Index main trend to down. A move through 27722.75 will signal a resumption of the uptrend.
The minor range is 25802.96 to 27722.75. Its 50% level at 26762.86 is the nearest pivot price resistance.
The short-term range is 24425.34 to 27722.75. Its retracement zone at 26074.05 to 25684.95 is the first support zone. It was tested briefly last week.
The intermediate range is 20690.25 to 27722.75. Its retracement zone target is 24206.50 to 23376.67.
The long-term range is 14784.03 to 27722.75. Its retracement zone target area is 21253.39 to 19726.62.
The 52-week moving average at 24615.85 is important potential support as well as a solid trend indicator. It has been guiding the market higher since the week-ending April 10.
Weekly Alphabet Inc. Technical Analysis
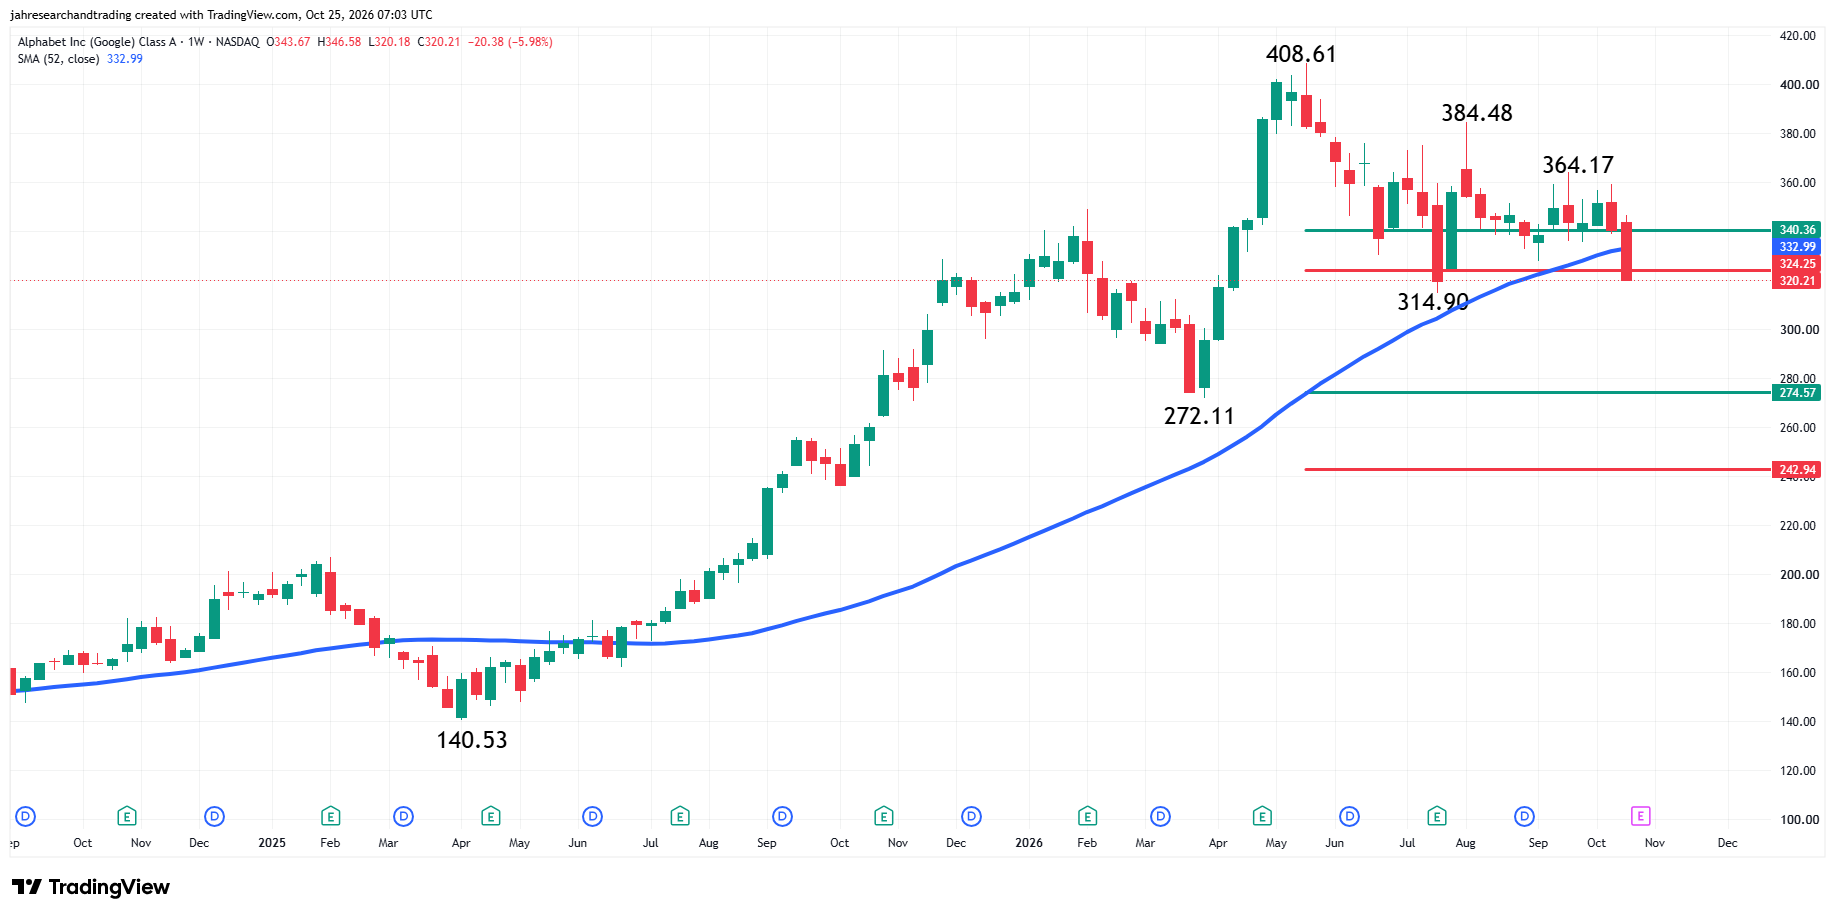
Alphabet settled sharply lower last week. The main trend is down according to the weekly swing chart. A trade through $364.17 will change the main trend to up. A trade through $314.90 will reaffirm the downtrend.
The short-term range is $272.11 to $408.61. Alphabet closed on the weak side of its retracement zone at $324.25 to $340.36, making it new resistance.
The intermediate range is $140.53 to $408.61. Its 50% to 61.8% zone is $274.57 to $242.94.
Alphabet also finished on the bearish side of the 52-week moving average at $332.99. This is the first time it’s been under this indicator since June 16 when it was trading at $166.64.
Weekly Microsoft Technical Analysis
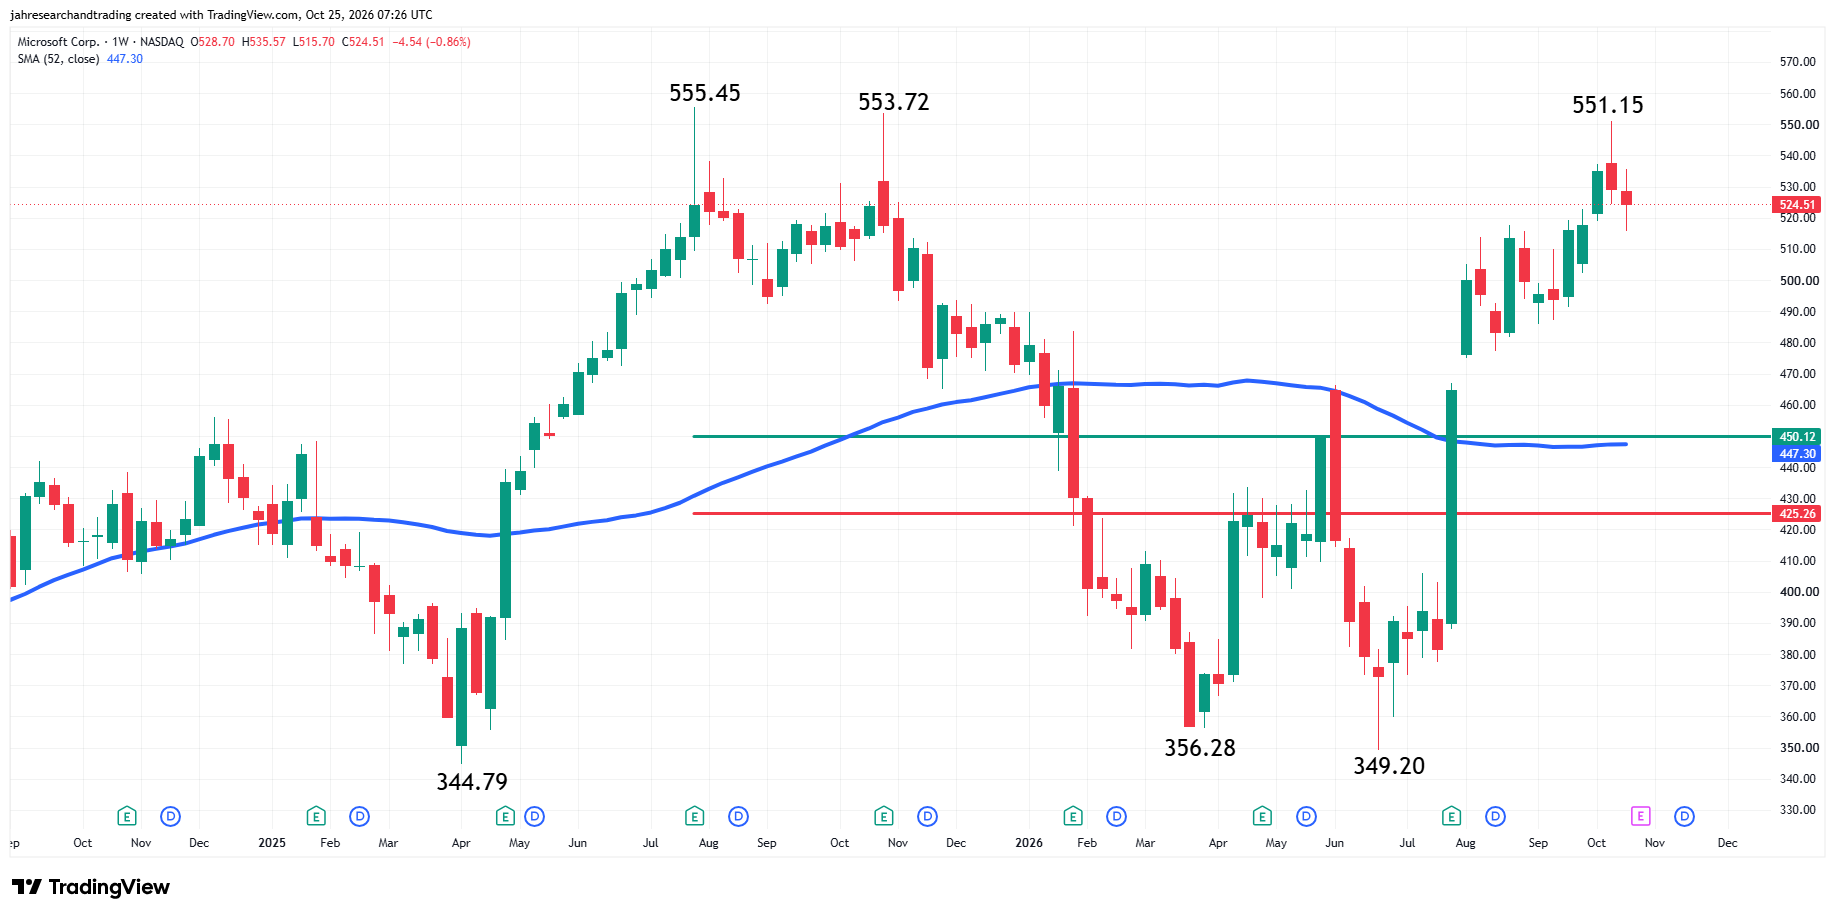
Microsoft is in an uptrend according to the weekly swing chart. However, the weekly closing price reversal top at $551.15 the week-ending October 16 could weigh on the stock for at least another one-to-two-weeks. It’s not a change in trend, but a chart pattern that often forms to alleviate excessive upside pressure.
A trade through $551.15 will negate the closing price reversal top, while a move through $553.72 will change the main trend to up. Taking out $555.45 will reaffirm the uptrend. The nearest swing bottom is $349.20. A trade through this level will change the main trend to down.
The main range is $344.79 to $555.45. Its 50% to 61.8% retracement zone at $450.12 to $425.26 is the next major downside target. Inside this zone is the 52-week moving average at $447.30.
What to Watch
Nasdaq Composite Index
My bias is to the upside for the Nasdaq Composite Index because of the swing chart trend, but my outlook has been weakening since the index crossed the weak side of the 50% level at 26762.86. This led to increased downside pressure that brought the index to within striking distance of the swing bottom at 25802.96 and a change in trend to the downside.
The index straddled the next 50% level at 26074.05 before finishing below. This suggests that trader reaction to this level will set the tone next week.
A sustained move over 26074.05 could lead to a retest of 26762.86. Overcome this and the record high at 27722.75 will be back in play.
A sustained move under 26074.05 will signal the presence of sellers. This condition could lead to a test of the main bottom at 25802.96, followed by the 61.8% level at 25684.95. This is a potential trigger point for an acceleration to the downside with the 52-week moving average at 24615.85 the next major target.
The index will begin to open up to the downside on a sustained move under the 52-week moving average with potential targets at 24206.50 to 23376.67 and 21253.39 to 19726.62.
Keep your eyes on 26074.05. If the index can recapture this level then we could see a near-term rally. If it fails and sellers come in with conviction, we could be looking at a change in trend to down and further downside pressure. The 52-week moving average will determine the magnitude of the sell-off.
Alphabet
My bias for Alphabet going into this week’s earnings report is to the downside because of the downtrend on the swing chart, the close on the weak side of the short-term retracement zone and the breakdown under the 52-week moving average.
Taking out the swing bottom at $314.90 will strengthen my outlook with the intermediate retracement zone at $274.57 to $242.94 the next major target area.
A trade through the swing bottom at $272.11 will also indicate the stock is in the strong hands of short-sellers.
My outlook will weaken if buyers can overcome the 52-week moving average at $332.99 and the short-term 50% level at $340.36.
Microsoft
With the main trend up on the weekly swing chart and Microsoft above the 52-week moving average, my bias is to the upside. Nonetheless, the confirmation of the closing price reversal top and the distance from the current price to the support zone and the 52-week moving average have softened my outlook. The stock is in an uptrend, but vulnerable to a steep near-term correction.
More Information in our Economic Calendar.