



Stocks Turn Lower After Early Gains
After a promising start, the major U.S. stock indexes are trading lower on Friday. Shortly before the midsession, the tech-weighted Nasdaq Composite is down about 1.49%. The benchmark S&P 500 Index is down 0.92% and the Dow Jones Industrial Average is 0.27% lower. Nonetheless, the stock market is still holding on to weekly gains.
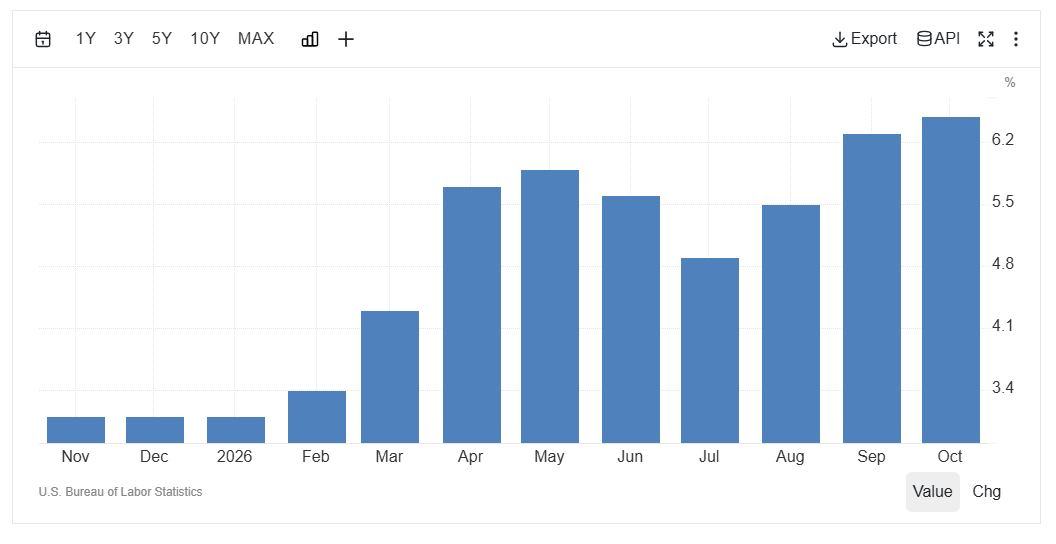
The indexes initially rose after the October producer price index came in lower than expected. However, on an annual basis, the index touched 6.5%. This is the biggest yearly change since November 2022. Investors interpreted the report as short-term improving, but long-term too high. The news didn’t alter expectations of a 25-basis point rate hike in December, but the chances of a 50-basis point rate hike fell.
The markets flipped to lower as the focus shifted back to Nvidia. Shares of the chip giant are down more than 2% on Friday after losing 4% the previous session. Sellers are reacting to the resignation of CEO and founder Jensen Huang.
Nvidia has been under pressure all week following reports that Huang had extramarital affairs, including one with a person U.S. intelligence suspects is a Chinese spy. According to CNBC, analysts believe that Huang’s exit could fuel a 20% correction in the stock.
Although a temporary CEO has been announced, the company’s board is expected to search both internally and externally for a full-time replacement.
Daily S&P 500 Index (SPX) Technical Analysis
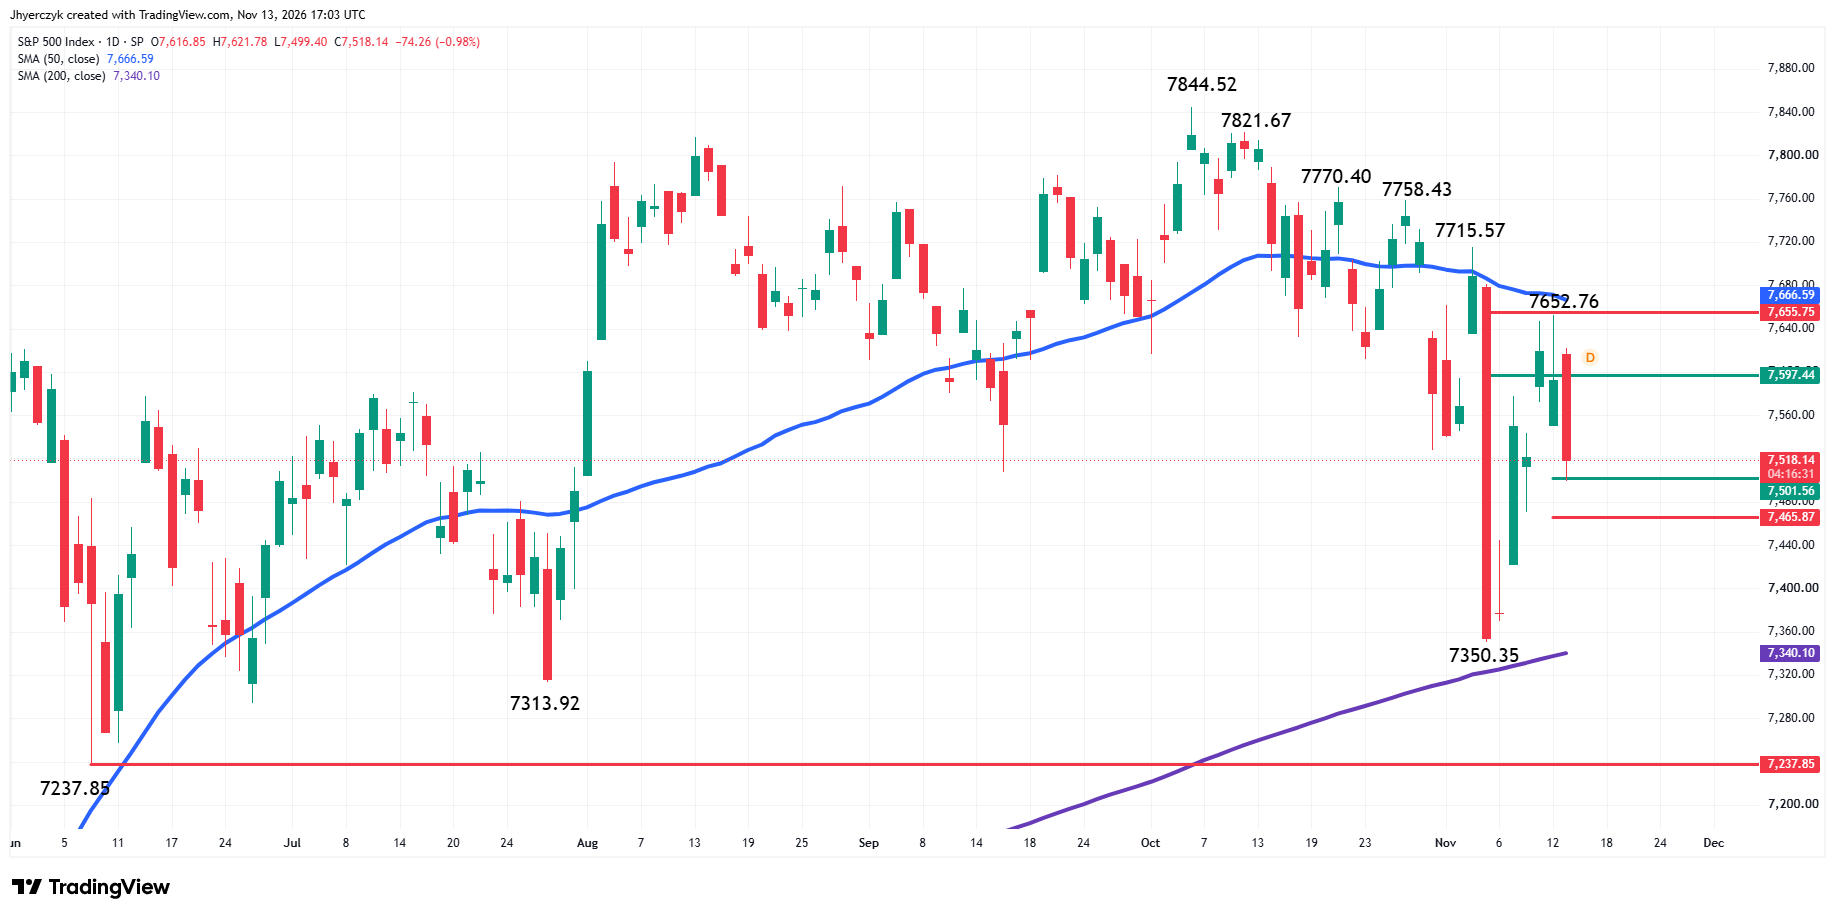
The S&P 500 Index is under pressure after a higher start. The main trend is down according to the daily swing chart. The new main top is 7652.76. A trade through this level will change the main trend to up. Taking out 7350.35 will signal a resumption of the downtrend.
The intermediate range is 7844.52 to 7350.35. Its retracement zone at 7597.44 to 7655.75 stopped the index three times this week.
The short-term range is 7350.35 to 7652.76. The next downside target zone is its retracement zone at 7501.56 to 7465.87. Today’s low is 7499.40, which is just under the 50% level of the zone.
The index is also being capped by the 50-day moving average at 7666.66, with potential support at the 200-day moving average at 7340.12.
Dow Jones Price Forecast
Every new Dow Jones analysis as it publishes, today's technical signal and key levels, live price — on one page.
See all Dow Jones forecastsDaily Nasdaq Composite Index (IXIC) Technical Analysis
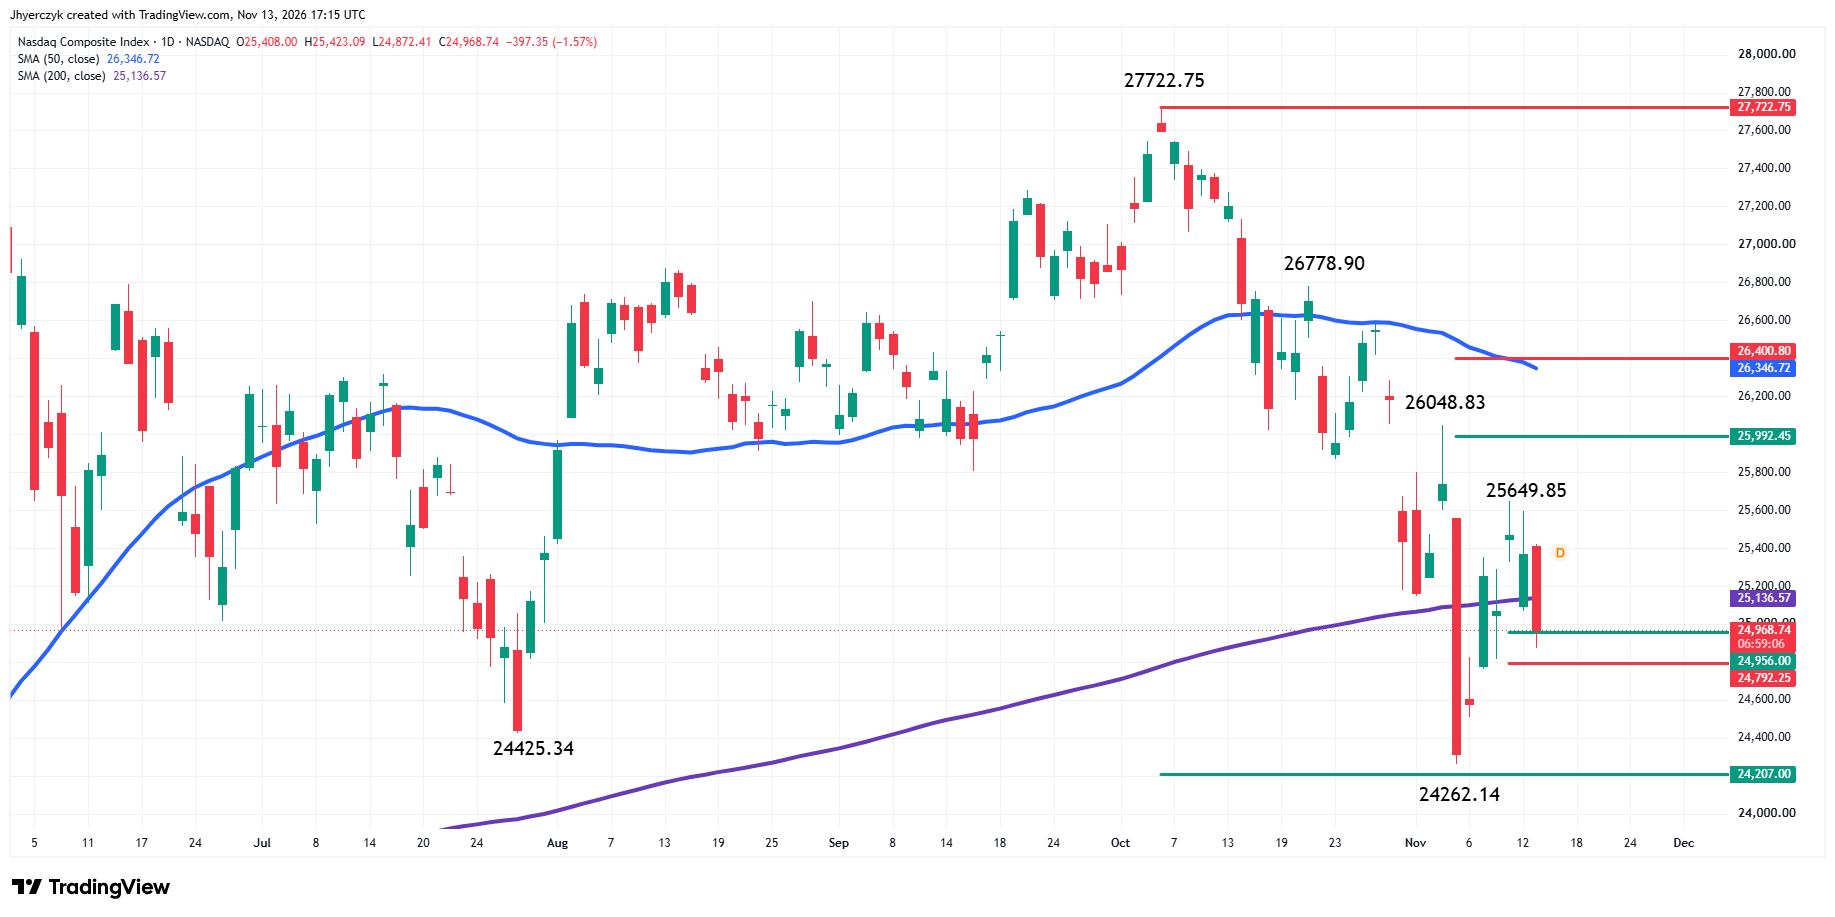
The Nasdaq Composite is lower. The main trend is down according to the daily swing chart. A trade through 25649.85 will change the main trend to up. Taking out 24262.14 will reaffirm the downtrend.
The intermediate range is 27722.75 to 24262.14. Its retracement zone at 25992.45 to 26400.80 is resistance. Inside this zone is the 50-day moving average at 26346.70.
The short-term range is 24262.14 to 25649.85. Its retracement zone at 24956.00 to 24792.25 was tested earlier in the session when the low of the day was formed at 24872.41.
Throughout the session on Friday, the index straddled the 200-day moving average at 25136.94. Currently, it is trading below this indicator, making it resistance.
What to Watch
S&P 500 Index (SPX)
With the main trend down and the 50-day moving average at 7666.66 providing resistance, my bias is to the downside. My outlook will strengthen if sellers can sustain a move under the 50% level at 7501.56. Taking out the 61.8% level at 7465.87 could trigger an acceleration to the downside with the next major objective the potential support cluster formed by the main bottom at 7350.35 and the 200-day moving average at 7340.12.
My bearish outlook will weaken if buyers recover the 50% level at 7597.44 and the 61.8% level at 7655.75. My bias will shift to bullish on a sustained move over the 50-day moving average at 7666.66.
Nasdaq Composite (IXIC)
The main trend is down on the swing chart and the index is below the 200-day moving average at 25136.94, so my bias is to the downside. However, it is likely to shift to the upside on a sustained rally over the 200-day moving average.
A sustained move under the 200-day moving average could lead to a retest of the retracement zone at 24956.00 to 24792.25. The inability to break through this zone will weaken my outlook because it could be an indication of counter-trend buyers.
Taking out 24792.25 will strengthen my bearish outlook. This could trigger a sharp break into the main bottom at 24262.14 and possibly the long-term 50% level at 24207.00.
More Information in our Economic Calendar.