



Anthropic IPO Is Lifting the Chip Trade
The major U.S. stock indexes are trading higher shortly before the mid-session on Monday. Traders are saying the catalyst behind the move is a jump in semiconductors fueled by Anthropic’s IPO filing.
At 15:54 GMT, the S&P 500 Index is trading 7683.86, up 60.18 or +0.79%. The Nasdaq Composite is trading 26225.091, up 269.749 or +1.04%.
The rally goes a little beyond just semiconductors too. Other AI-related shares also rose after Anthropic filed for an IPO. The news brought in new money as speculators increased bets that the new offering would breathe some life into a technical sub-sector that had been treading water lately.
Riding the wave of the bullish news was shares of Nvidia which rose 1.4%. Micron was up 2.3%, Broadcom rose 1.5% and Advanced Micro Devices increased 1.3%.
Neocloud Debt Still Has Sellers
Today’s early price action is not all bullish for stocks. The so-called neocloud stocks were under pressure. The move is being fueled by investors worried about companies borrowing too much to expand their AI operations. The recent surge in yields likely led to these concerns. The prices of shares continued to erode for companies like CoreWeave and Nebius Group.
Elon Musk, CEO of Tesla and SpaceX warned that a lot of these companies may go out of business if they are cut off from the debt markets.
In other news, a dip in oil prices lent some support to the major indexes. International benchmark Brent fell 1.4% and U.S. benchmark WTI dropped 2%. Nonetheless, just last Friday, oil prices spiked to multi-month highs on the fear that the U.S. and Israel are planning renewed attacks on Iran after the November U.S. midterm elections.
Investors seemed to set aside concerns about the Fed’s interest rate announcement on Wednesday. This is probably because the Fed Funds traders are pricing in a 90% probability that policymakers will hold interest rates at the current target range of 3.75% to 4%.
Dow Jones Price Forecast
Every new Dow Jones analysis as it publishes, today's technical signal and key levels, live price — on one page.
See all Dow Jones forecastsDaily S&P 500 Index (SPX) Technical Analysis
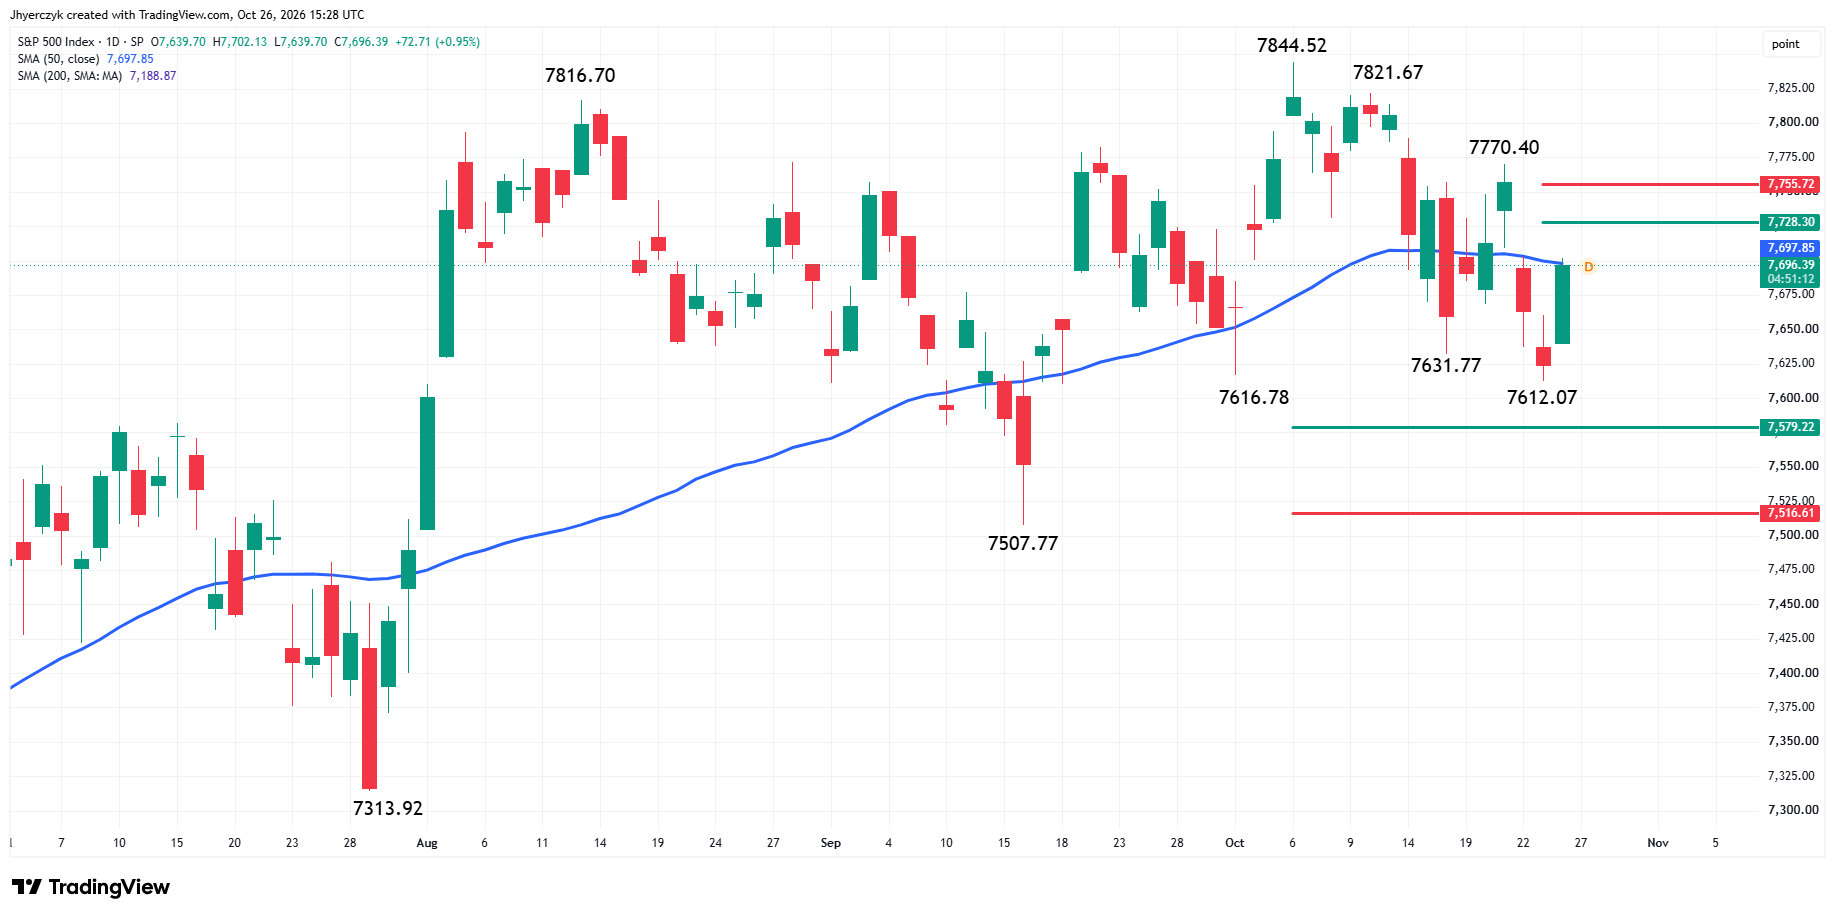
The S&P 500 Index is sharply higher on Monday in counter-trend trading. The main trend is down according to the daily swing chart, however, upside momentum could increase if the index can recover the 50-day moving average at 7697.86.
The main trend will change to up if buyers can take out the last swing top at 7770.40. A trade through 7612.07 will signal a resumption of the downtrend.
The short-term range is 7844.52 to 7612.07. Its retracement zone at 7728.30 to 7755.72 is the next potential upside target.
The long-term range is 7313.92 to 7844.52. Its retracement zone at 7579.22 to 7516.61 is major support.
The swing chart is in a downtrend, but the market is threatening to overtake the 50-day moving average at 7697.86, which could shift momentum to the upside. This could then extend the rally into the short-term retracement zone at 7728.30 to 7755.72.
Sellers could return on a rally into the short-term retracement zone. Bearish traders are likely to defend against a breakout over 7770.40 and a change in trend to up.
Daily Nasdaq Composite (IXIC) Technical Analysis
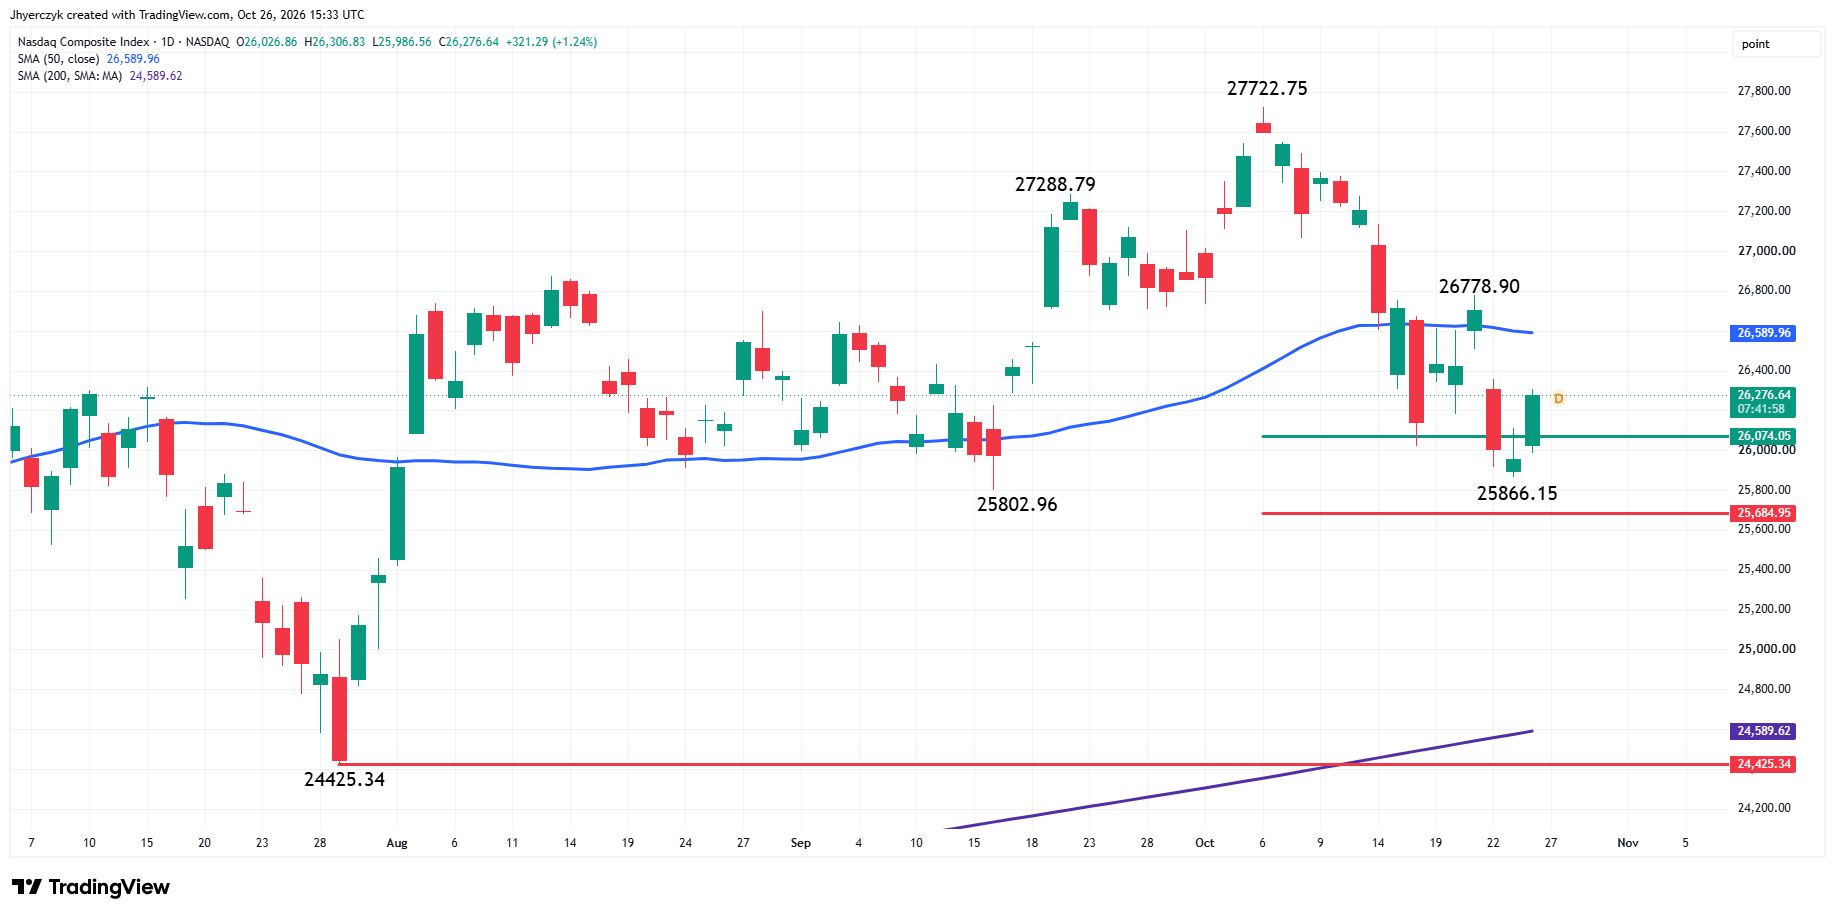
The Nasdaq Composite is higher on Monday. The main trend is down according to the daily swing chart. A trade through 25866.15 will signal a resumption of the downtrend. The main trend will change to up if buyers can take out the swing top at 26778.90.
The main range is 24425.34 to 27722.75. Its retracement zone is support at 26074.05 to 25684.95. Today’s rally began after a minor swing bottom was formed inside this zone on Friday at 25886.15. If this counter-trend move creates enough upside momentum then look for a near-term surge into the 50-day moving average at 26590.25.
The 50-day moving average may be the indicator that determines whether the rally stalls or continues. If it stalls, we’re likely to see a retest of 26074.05 to 25684.95. If buyers trigger a breakout over the 50-day moving average then look for a follow-through move into the swing top at 26778.90. If buyers overcome this level then look for the trend to change to up and for the rally to possibly extend into at least 26794.45.
What to Watch
S&P 500 Index
My bias is still to the downside because of the swing chart downtrend, but my outlook will weaken if buyers can overcome the 50-day moving average at 7697.86. If that’s the case today, new buyers may try to extend the counter-trend rally into the retracement zone at 7728.30 to 7755.72.
If you’re short with the trend indicator, keep in mind that you may take heat up to 7770.40 if there is a clean breakout over the 50-day moving average. If the rally stalls at the 50-day moving average then that will tell us that today’s buying is weak and that short-sellers may still be in control.
Nasdaq Composite
The swing chart is trending lower, but the price action suggests buyers may have found strong support at 26074.05 to 25684.95. The move has shifted my bias to the upside for a surge into the 50-day moving average at 26590.25.
We should find out within a day or two if this is the start of a sustained counter-trend rally, or just a kneejerk reaction to the Anthropic IPO news.
More Information in our Economic Calendar.