



The major U.S. stock indexes are trading higher shortly after the mid-session on Monday. Traders say the catalyst behind the move is a jump in semiconductors fueled by Anthropic’s IPO filing.
At 18:02 GMT, the S&P 500 Index is trading 7673.95, up 50.27 or +0.66%. It reached a session high at 7702.13 and a low at 7639.70. The Nasdaq Composite is trading 26178.74, up 223.40 or +0.86%. It reached a session high at 26306.83 and a low at 25986.56.
Anthropic IPO Creates an AI Bid
The rally goes a little beyond just semiconductors too. Other AI-related shares also rose after Anthropic filed for an IPO. The news brought in new money as speculators increased bets that the new offering would breathe some life into a technical sub-sector that had been treading water lately.
Neocloud Buyers Look Past the Debt Warnings
In a surprise development, shares of neocloud companies turned positive after earlier weakness. Shortly after the opening, the shares were down sharply after negative comments from Elon Musk. However, investors shrugged off the news and went bargain hunting, driving CoreWeave shares up 4.7% and Nebius Group stock up 2%.
Meta Platforms helped boost risk-on sentiment during the session when it announced plans to raise $95 billion to support its AI investments. This news complemented comments over the weekend from SpaceX CEO Elon Musk, who announced that his company had secured a $40 billion debt deal for AI chips.
Musk warned that a lot of these companies may go out of business if they are cut off from the debt markets. But the market seems to be treating the Meta and SpaceX announcements as signs that money is still available for the larger AI players.
Dow Jones Price Forecast
Every new Dow Jones analysis as it publishes, today's technical signal and key levels, live price — on one page.
See all Dow Jones forecastsInvestors are hoping that today’s rally becomes the start of something big. Although the Nasdaq did reach an all-time high on October 6, it has been struggling since then, posting back-to-back weekly losses. Weighing on the index have been the chipmakers, which are currently in a bear market. The SOXX ETF, for example, is off about 25% from its record high.
Oil, Fed and Earnings Are Up Next
After today, trader focus is likely to shift to three key factors that have been influencing the price action: crude oil prices, the Fed’s interest rate decision and earnings.
A drop in oil prices provided some support for stocks throughout the session, with Brent dropping close to 2% and WTI trading more than 2% lower.
Traders are also awaiting the Fed’s interest rate decision on Wednesday. It is widely expected to hold rates in the 3.75% to 4% range. However, the focus will be on what policymakers say about inflation and the possibility of a December rate hike.
Finally, we’re getting close to peak earnings season. After Meta’s worrisome earnings release last week, traders will get the opportunity to react to quarterly reports from Alphabet, Amazon and Microsoft, all of which carry enough weight to drive the indexes sharply lower with bad reports.
Daily S&P 500 Index (SPX) Technical Analysis
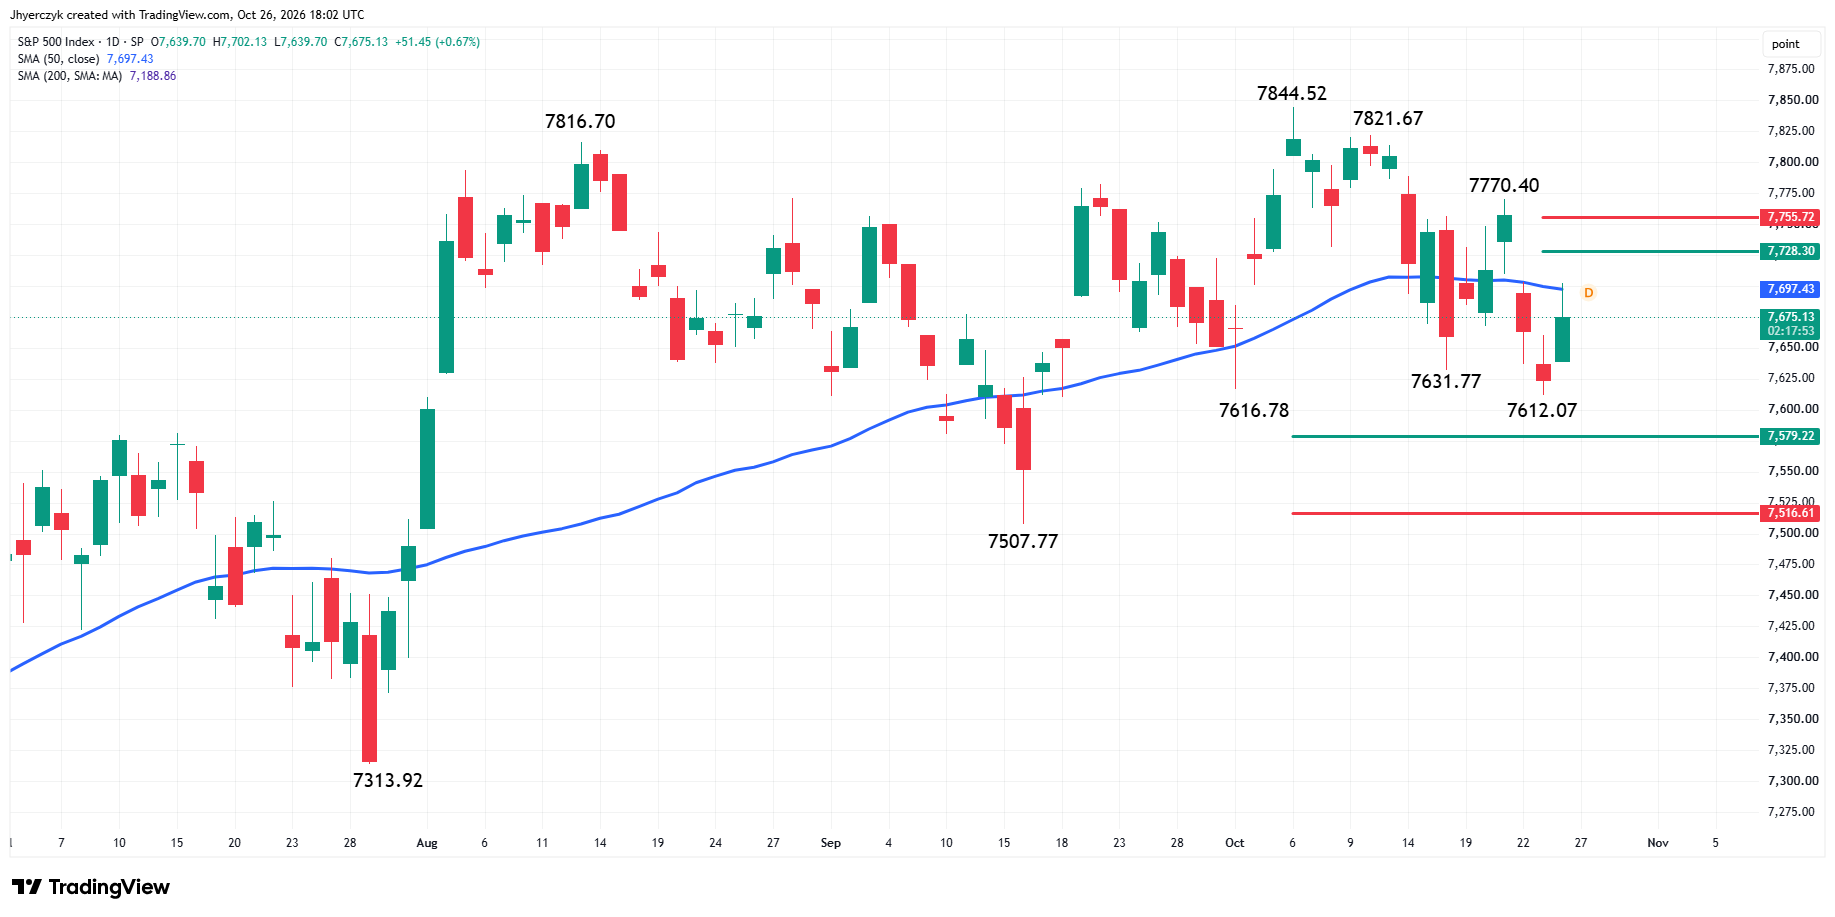
The S&P 500 Index is higher on Monday, but it has backed off its high at 7702.13 after briefly trading through the 50-day moving average at 7697.86. The main trend is down according to the daily swing chart. The inability to sustain the move over the 50-day moving average suggests sellers are still willing to defend this indicator.
The main trend will change to up if buyers can take out the last swing top at 7770.40. A trade through 7612.07 will signal a resumption of the downtrend.
The short-term range is 7844.52 to 7612.07. Its retracement zone at 7728.30 to 7755.72 is the next potential upside target.
The long-term range is 7313.92 to 7844.52. Its retracement zone at 7579.22 to 7516.61 is major support.
The swing chart is in a downtrend. The early rally proved buyers can still take offers, but the failure to hold above the 50-day moving average keeps the counter-trend move in check. A sustained move over the average could extend the rally into 7728.30 to 7755.72. If the index continues to trade below it, then today’s rally is likely to remain vulnerable to renewed selling pressure.
Daily Nasdaq Composite (IXIC) Technical Analysis
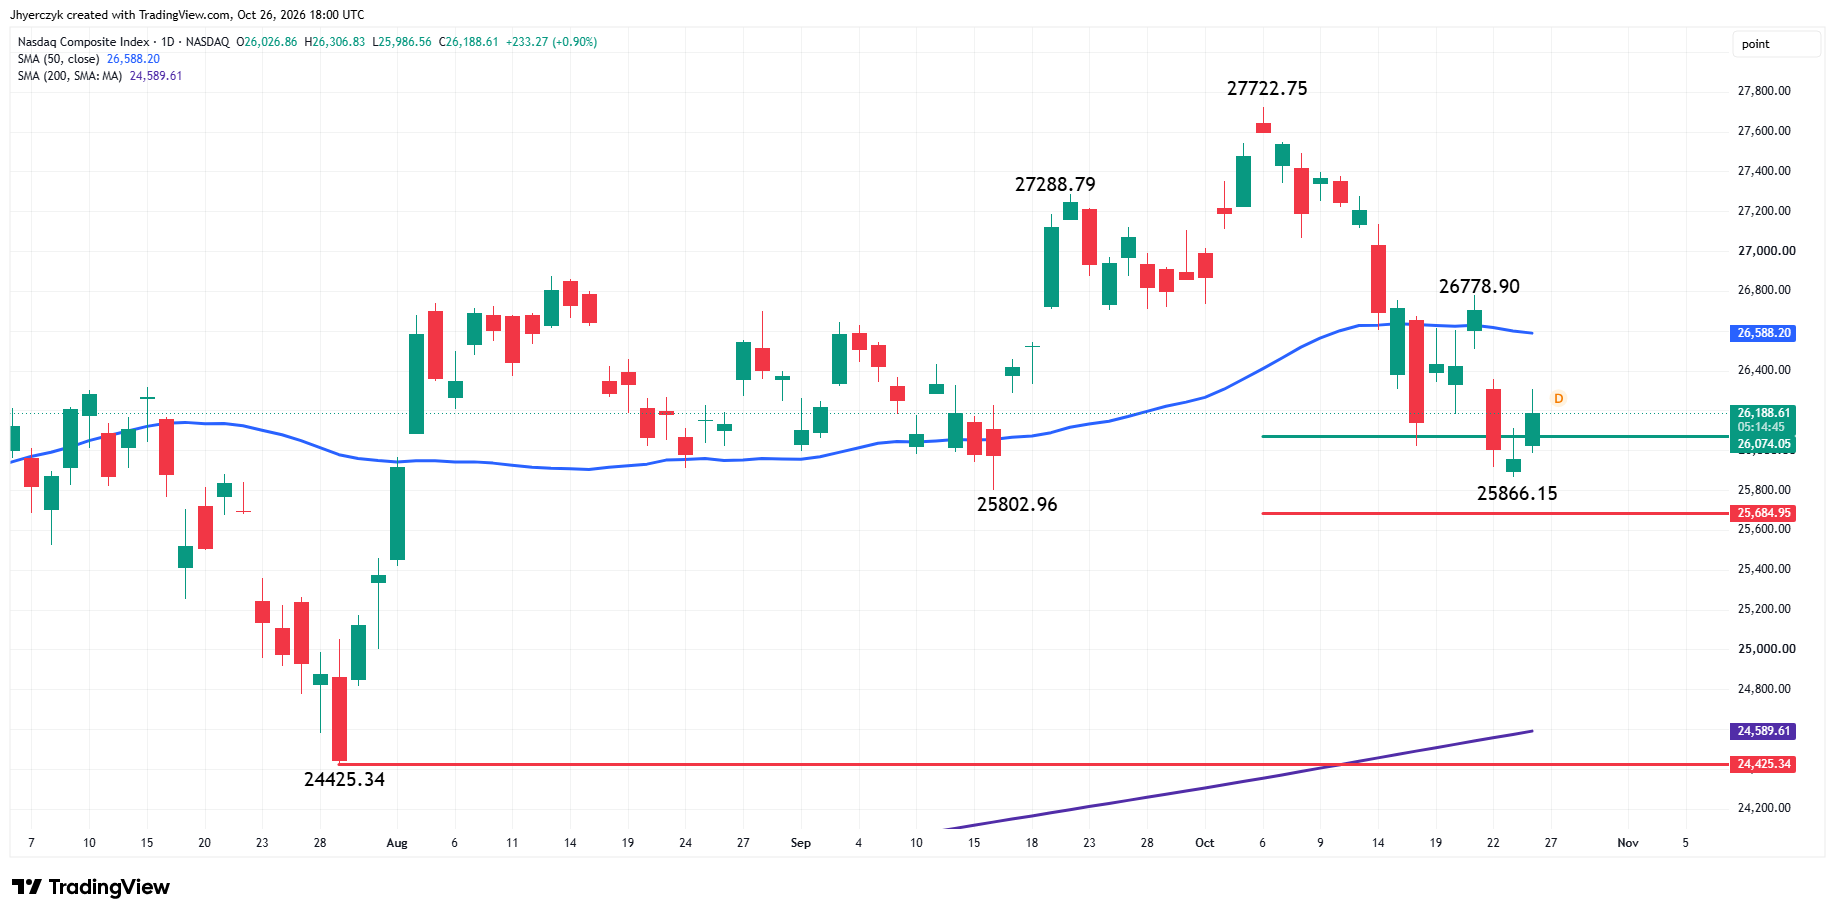
The Nasdaq Composite is higher on Monday, but it is off its session high at 26306.83. The main trend is down according to the daily swing chart. A trade through 25866.15 will signal a resumption of the downtrend. The main trend will change to up if buyers can take out the swing top at 26778.90.
The main range is 24425.34 to 27722.75. Its retracement zone is support at 26074.05 to 25684.95. Today’s rally began after a minor swing bottom was formed inside this zone on Friday at 25886.15.
The early rally did not generate enough momentum to threaten the 50-day moving average at 26590.25. That leaves this indicator as the next upside target if buyers can hold the index on the strong side of 26074.05.
The 50-day moving average may be the indicator that determines whether the rally stalls or continues. A sustained move over it could trigger a follow-through move into the swing top at 26778.90. If buyers overcome this level then look for the trend to change to up and for the rally to possibly extend into at least 26794.45.
What to Watch
S&P 500 Index
My bias is still to the downside because of the swing chart downtrend and the failure to hold above the 50-day moving average at 7697.86. The early rally showed buyers are willing to support the market, but they have not yet demonstrated the strength needed to change the momentum.
A sustained move over the 50-day moving average would weaken my bearish outlook and put 7728.30 to 7755.72 back on the radar. If the index remains below the average and turns lower, then sellers could press the market toward 7612.07. A trade through this level would reaffirm the downtrend.
Nasdaq Composite
The Nasdaq held the 26074.05 to 25684.95 support zone and produced a solid rally, but buyers have not yet shown enough strength to challenge the 50-day moving average at 26590.25. The swing chart remains down, but my near-term bias is to the upside as long as the index can hold above 26074.05.
A sustained move over the 50-day moving average would strengthen the buying and put 26778.90 on the radar. If the index fails to hold 26074.05, then today’s rally will look more like a kneejerk reaction to the Anthropic IPO news than the start of a sustained counter-trend move.
More Information in our Economic Calendar.