



The major U.S. stock indexes continue to hold on to gains late in the session on Tuesday. The catalysts are the same as this morning’s with a jump in chipmaker shares and a drop in crude oil prices providing the support. Buyers don’t seem to be too worried about a Fed rate hike at this time, but conditions could change 24 hours from now after the Fed releases its interest rate decision and issues its new policy statement.
At 19:25 GMT, the Dow Jones Industrial Average is trading 52383.96, up 22.38 or +0.04%. The S&P 500 Index is at 7719.75, up 42.98 or +0.56% and the Nasdaq Composite is trading 26462.718, up 293.336 or +1.12%.
On Monday, the rally was jumpstarted after Anthropic filed documents citing its plan to go public. Chipmakers led the charge, followed by a slew of AI-related names. On Tuesday, the market reacted positively to the news that a coalition of banks announced $63 billion in financing for the purchase of Broadcom’s technology for Anthropic, CNBC reported.
Traders also liked the news of lower oil prices. WTI and Brent both fell after Iranian Supreme Leader Mojtaba Khamenei and his top national security official Mohsen Rezaei revealed Iran’s conditions for ending the conflict.
Daily Nasdaq Composite (IXIC) Technical Analysis
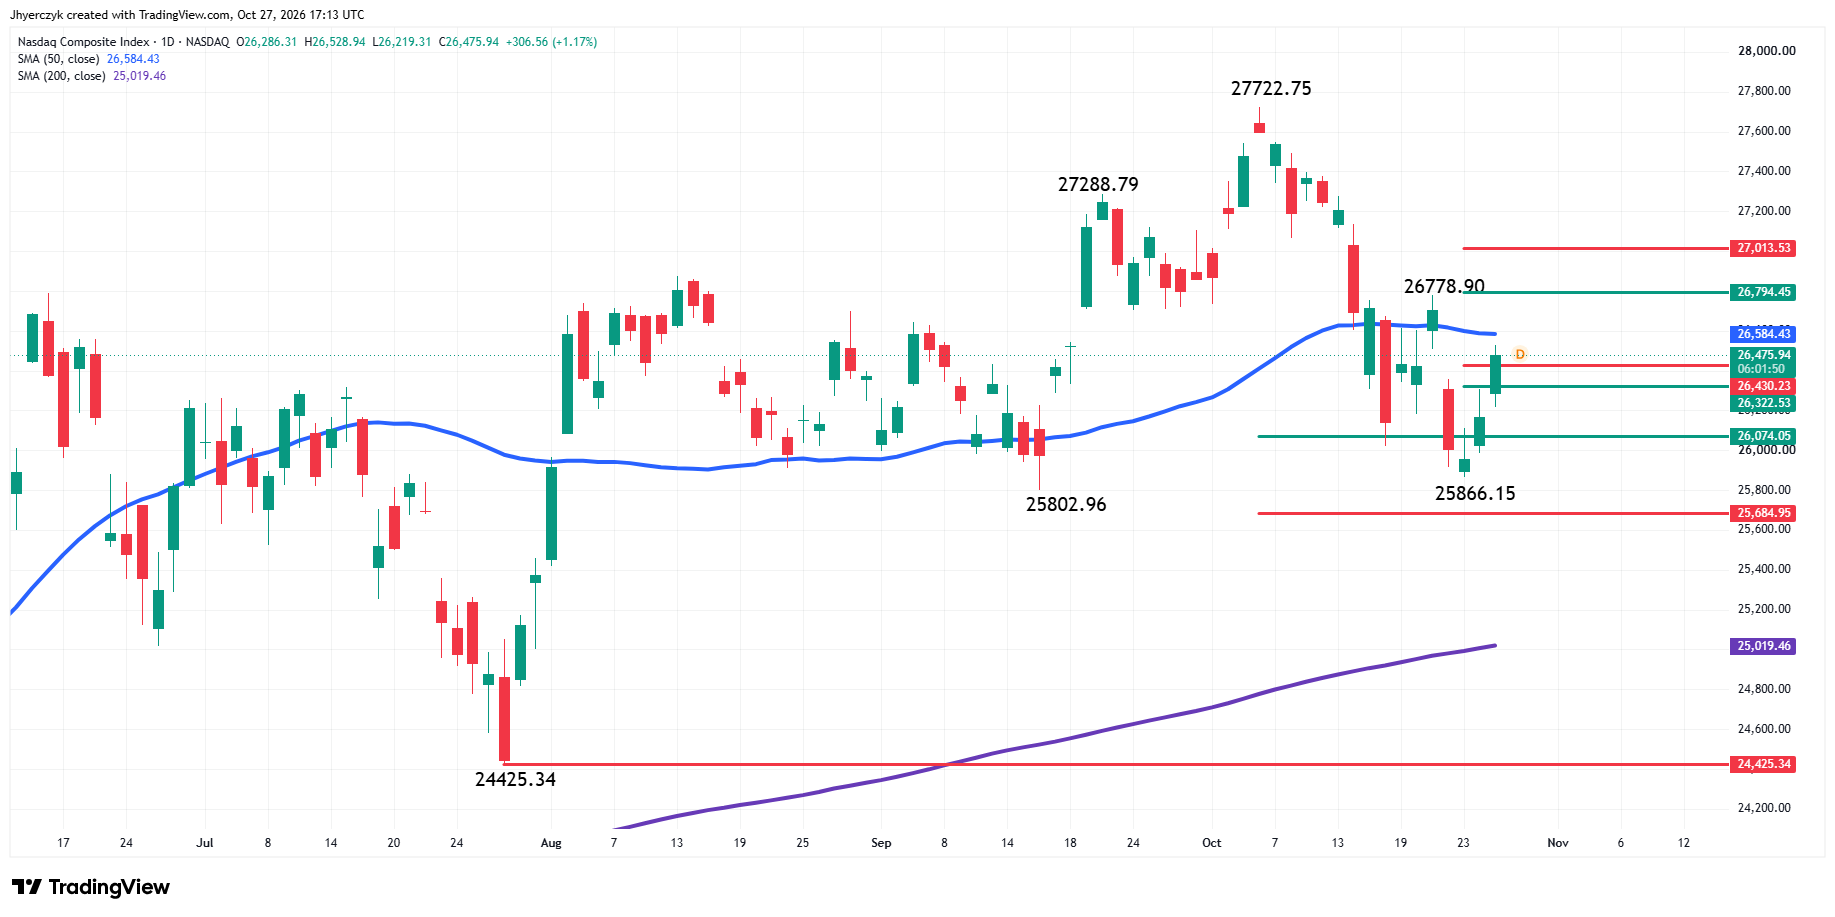
The Nasdaq Composite is trading higher late Tuesday. The main trend is down according to the daily swing chart. A trade through 26778.90 will change the main trend to up. A move through 25866.15 will signal a resumption of the downtrend.
The new short-term range is 26778.90 to 25866.15. Its retracement zone is 26322.53 to 26430.23. Trader reaction to this zone is likely to determine the direction of the index into the close. This zone was tested earlier in the session.
Overcoming the 61.8% level at 26430.23 could spike prices into the 50-day moving average later today. However, a sustained move under 26322.53 could lead to a retest of the long-term 50% level at 26074.05.
The 50-day moving average may be the next indicator that determines whether the two-day rally stalls or continues. If it stalls, we’re likely to see a retest of 26074.05 to 25684.95.
If there is a breakout over the 50-day moving average then look for a follow-through move into the swing top at 26778.90. If buyers overcome this level then look for the trend to change to up and for the rally to possibly extend into the retracement zone at 26794.45 to 27013.53.
NASDAQ 100 Price Forecast
Every new NASDAQ 100 analysis as it publishes, today's technical signal and key levels, live price — on one page.
See all NASDAQ 100 forecastsDaily December E-mini Nasdaq-100 Index Futures Technical Analysis
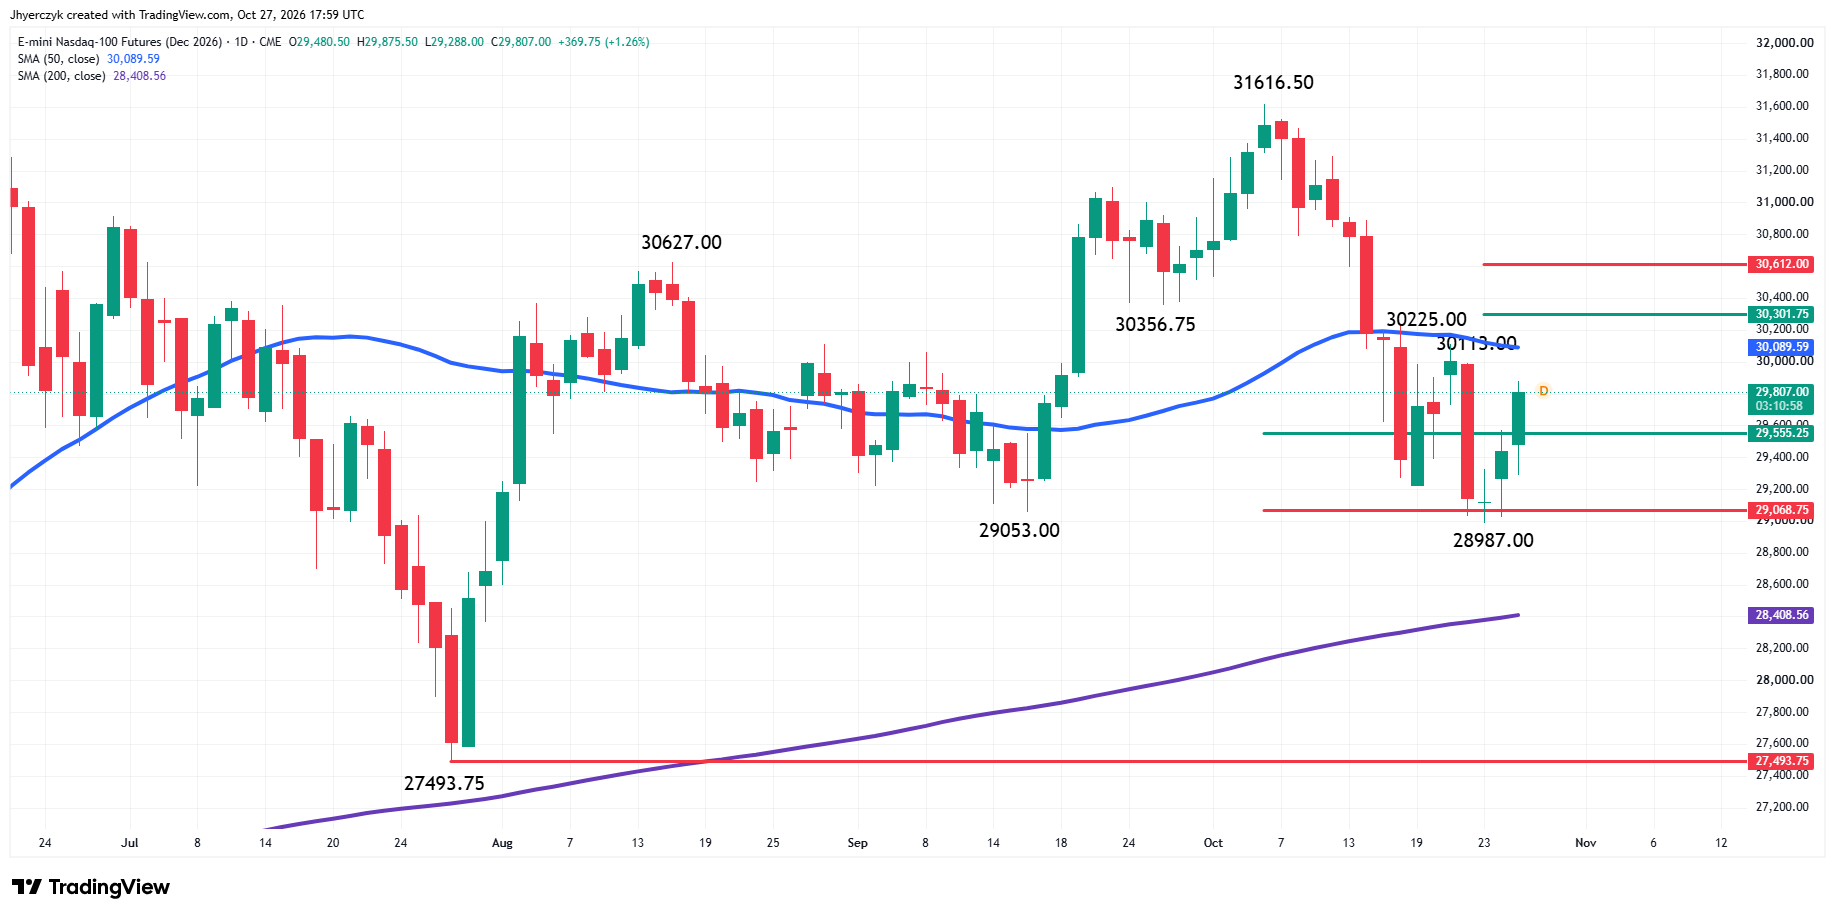
December E-mini Nasdaq-100 Index futures are higher on Tuesday. The main trend is down according to the daily swing chart. However, today’s upside momentum has put the market in a position to challenge the 50-day moving average at 30089.73 and a minor top at 30113.00 and a main top at 30225.00.
Crossing to the strong side of the 50-day moving average will put the futures contract in a position to challenge the minor swing top at 30113.00 then the main swing top at 30225.00. Taking out this level would change the main trend to up and strengthen the rally. It will also put the short-term retracement zone at 30301.75 to 30612.00 on the radar.
A sustained move over 30612.00 will put the index in a position to challenge the record high at 31616.50.
On the downside, a failure to overcome the 50-day moving average will be a sign of weakness. If this creates enough downside momentum then look for a retest of the long-term support zone at 29555.25 to 29068.75.
Daily December E-mini S&P 500 Index Futures Technical Analysis
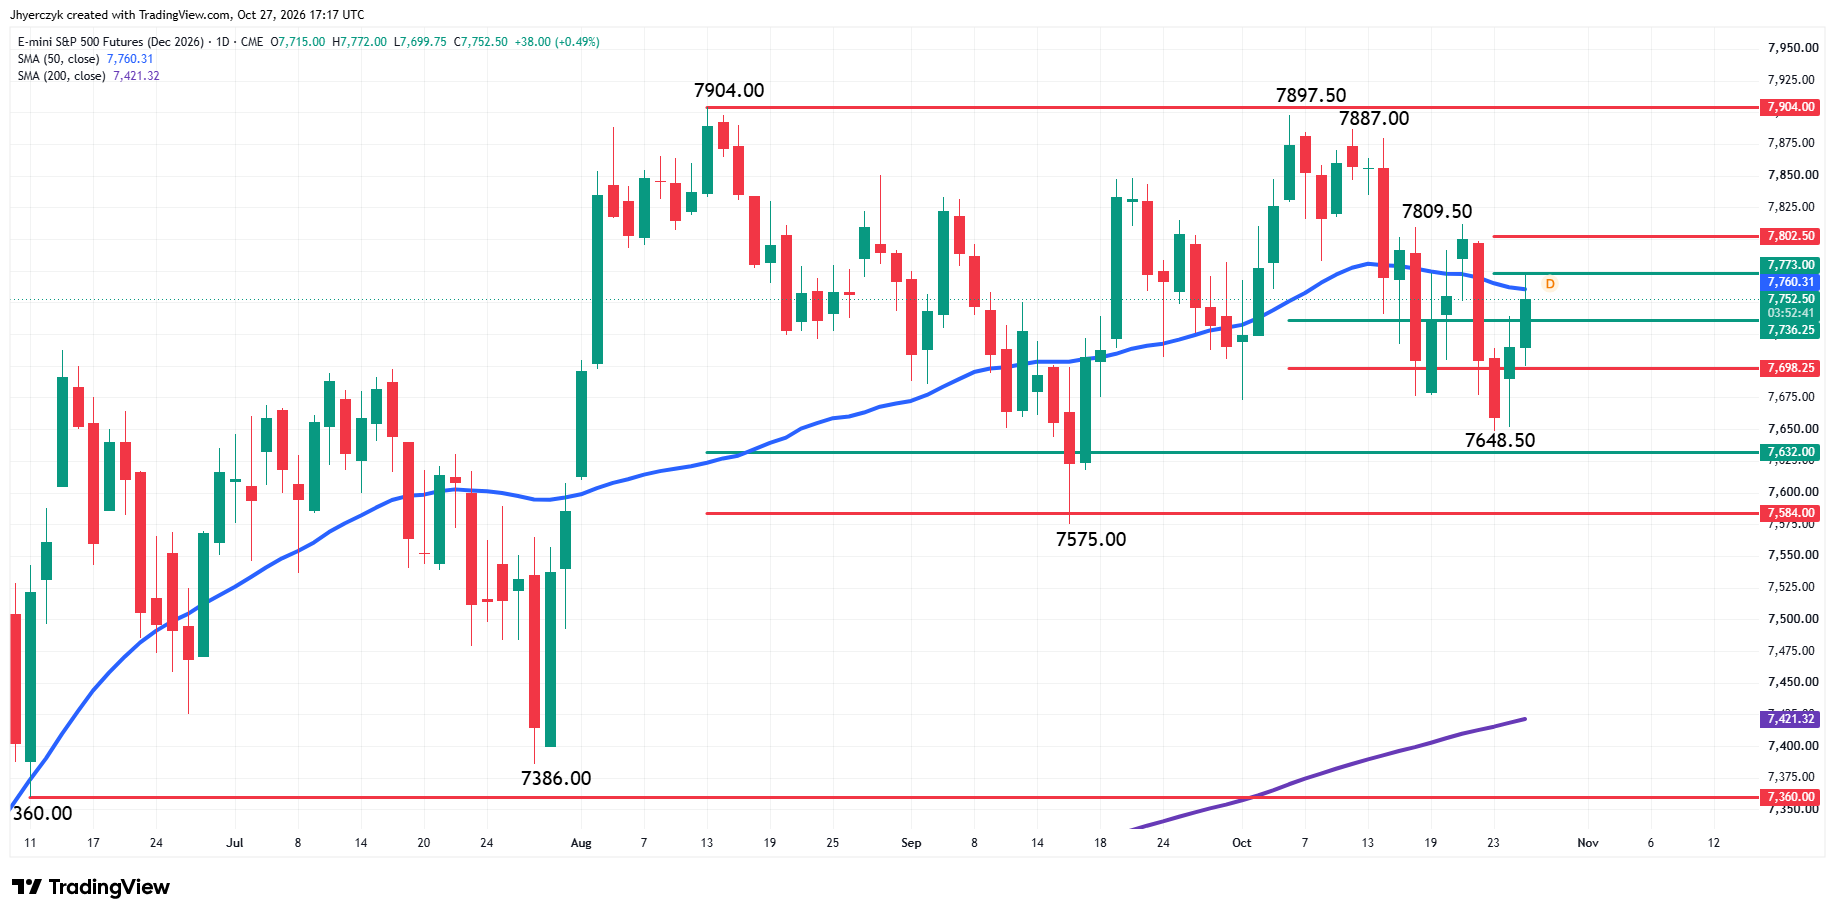
December E-mini S&P 500 Index futures are making a strong move on Tuesday. The main trend is down according to the daily swing chart, but two straight rallies have turned Friday’s low at 7648.50 into a new main bottom. A trade through 7812.25 will change the main trend to up.
The long-term range is 7386.00 to 7904.00. Its retracement zone at 7632.00 to 7584.00 is support. Friday’s low was just above this zone.
The intermediate-term range is 7575.00 to 7897.50. The index had been straddling its retracement zone at 7736.25 to 7698.25 for about a week. Last week the market fell to the weak side of the zone, but it is now trading on the strong side, making it support again.
The short-term range is 7897.50 to 7648.50. Its retracement zone at 7773.00 to 7802.50 is the first target area after the 50-day moving average at 7760.37.
What to Watch
Nasdaq Composite
The long-term range is 24425.34 to 27722.75. Its retracement zone is support at 26074.05 to 25684.95. The current two-day rally began after a low was formed inside this zone on Friday at 25866.15. The swing chart is trending lower, but the price action suggests buyers may have found strong support at 26074.05 to 25684.95. Overcoming the 50-day moving average and sustaining the move could be the proof.
December E-mini Nasdaq-100 Index Futures
My bias is to the downside, but it weakened earlier in the session on the breakout over the 50% level at 29555.25. My outlook will turn bullish if the index crosses to the strong side of the 50-day moving average then takes out the main swing top at 30225.00.
December E-mini S&P 500 Index Futures
The daily swing chart is trending lower and the index is below the 50-day moving average at 7760.37, which is giving me my downside bias. A sustained move over the 50-day moving average will weaken my outlook, but I won’t be convinced that the trend is getting ready to change unless buyers can overcome the short-term retracement zone at 7773.00 to 7802.50.
More Information in our Economic Calendar.