



Tech Stocks Rally as Nvidia Volatility Tests US Indices
The major U.S. stock indexes are higher late Monday, underpinned by a drop in oil prices and strong demand for technology shares. Some traders are blaming the volatility on last Tuesday’s midterm election results, which saw the Democrats take control of both houses. In the wake of this win, some traders believe the Democrats will implement tighter regulations on data centers. This could lead to lower demand for chip stocks and AI-related products.
Monday’s stock market has been volatile from the get-go. E-mini stock index futures plunged shortly after the opening as the focus shifted from broad market issues to Nvidia.
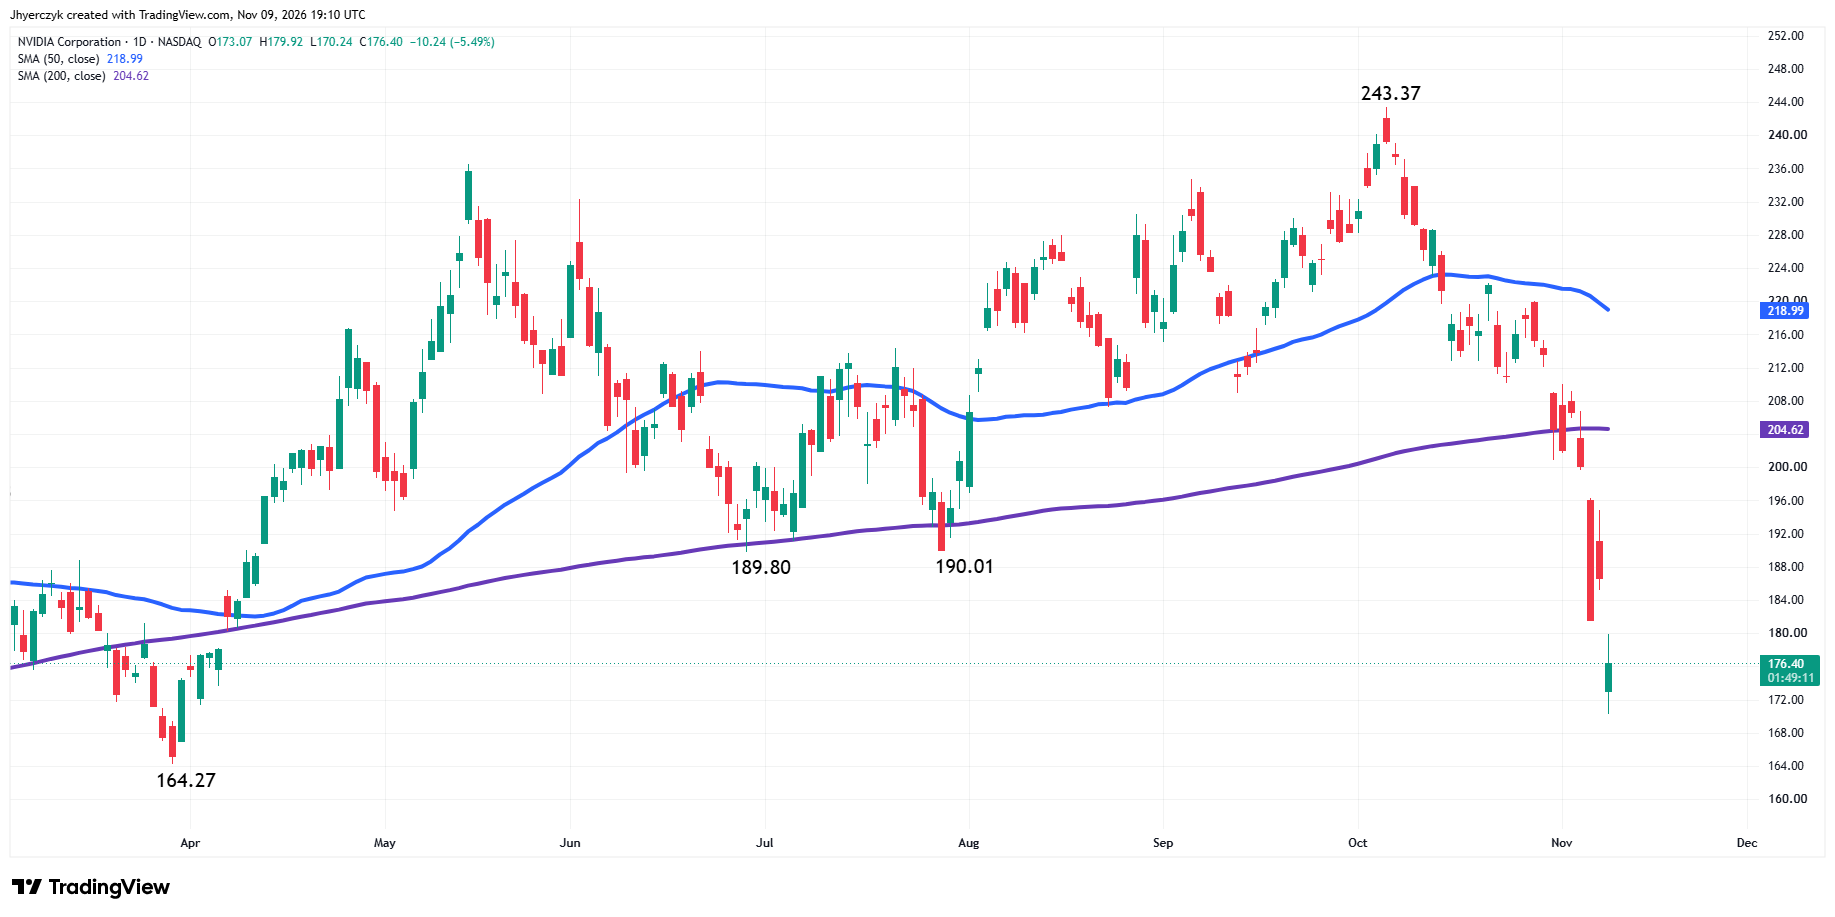
Nvidia moved to the forefront over the weekend after its board of directors said they were going to open an investigation into co-founder and CEO Jensen Huang’s relationship with a woman who U.S. intelligence agencies say is a Chinese spy. Nvidia shares took the hit, but speculators jumped in on the weakness, helping to launch today’s strong rally.
Other traders just believed that chip stocks got too cheap and were ripe for a reversal to the upside. Whatever the reason for the strength, it is likely tied to an oversold sector or stock, a key retracement zone, or the testing of a major moving average.
Daily S&P 500 Index (SPX) Technical Analysis
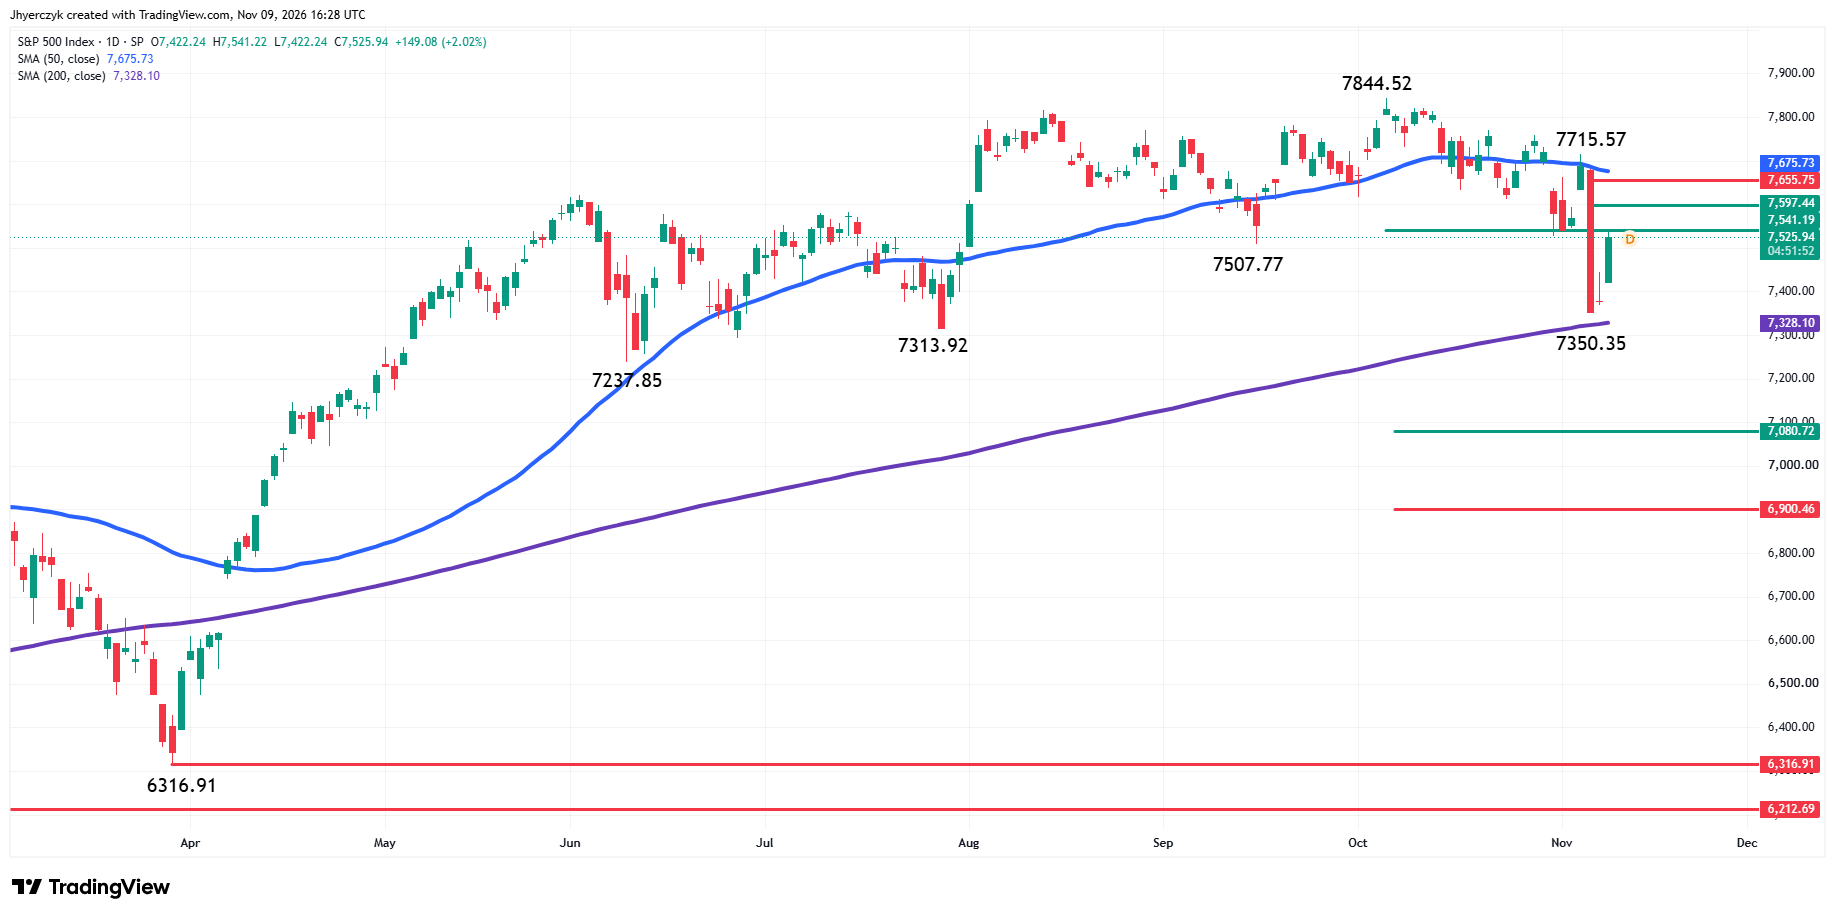
The S&P 500 Index is higher on Monday, but the daily swing chart is still in a downtrend. A trade through 7350.35 will signal a resumption of the downtrend. A trade through 7715.57 will change the main trend to up, with 7844.52 the next major upside target.
The long-term range is formed by the March 30 main bottom at 6316.91 and the October 6 main top at 7844.52. This creates a potential support zone at 7080.72 to 6900.46.
The intermediate range is 7237.85 to 7844.52. The 50% level of this range is 7541.19.
The short-term range is 7844.52 to 7350.35. Its retracement zone at 7597.44 to 7655.75 is potential resistance.
The SPX is also trading between 200-day moving average support at 7328.10 and 50-day moving average resistance at 7675.73.
Dow Jones Price Forecast
Every new Dow Jones analysis as it publishes, today's technical signal and key levels, live price — on one page.
See all Dow Jones forecastsDaily Nasdaq Composite Index (IXIC) Technical Analysis
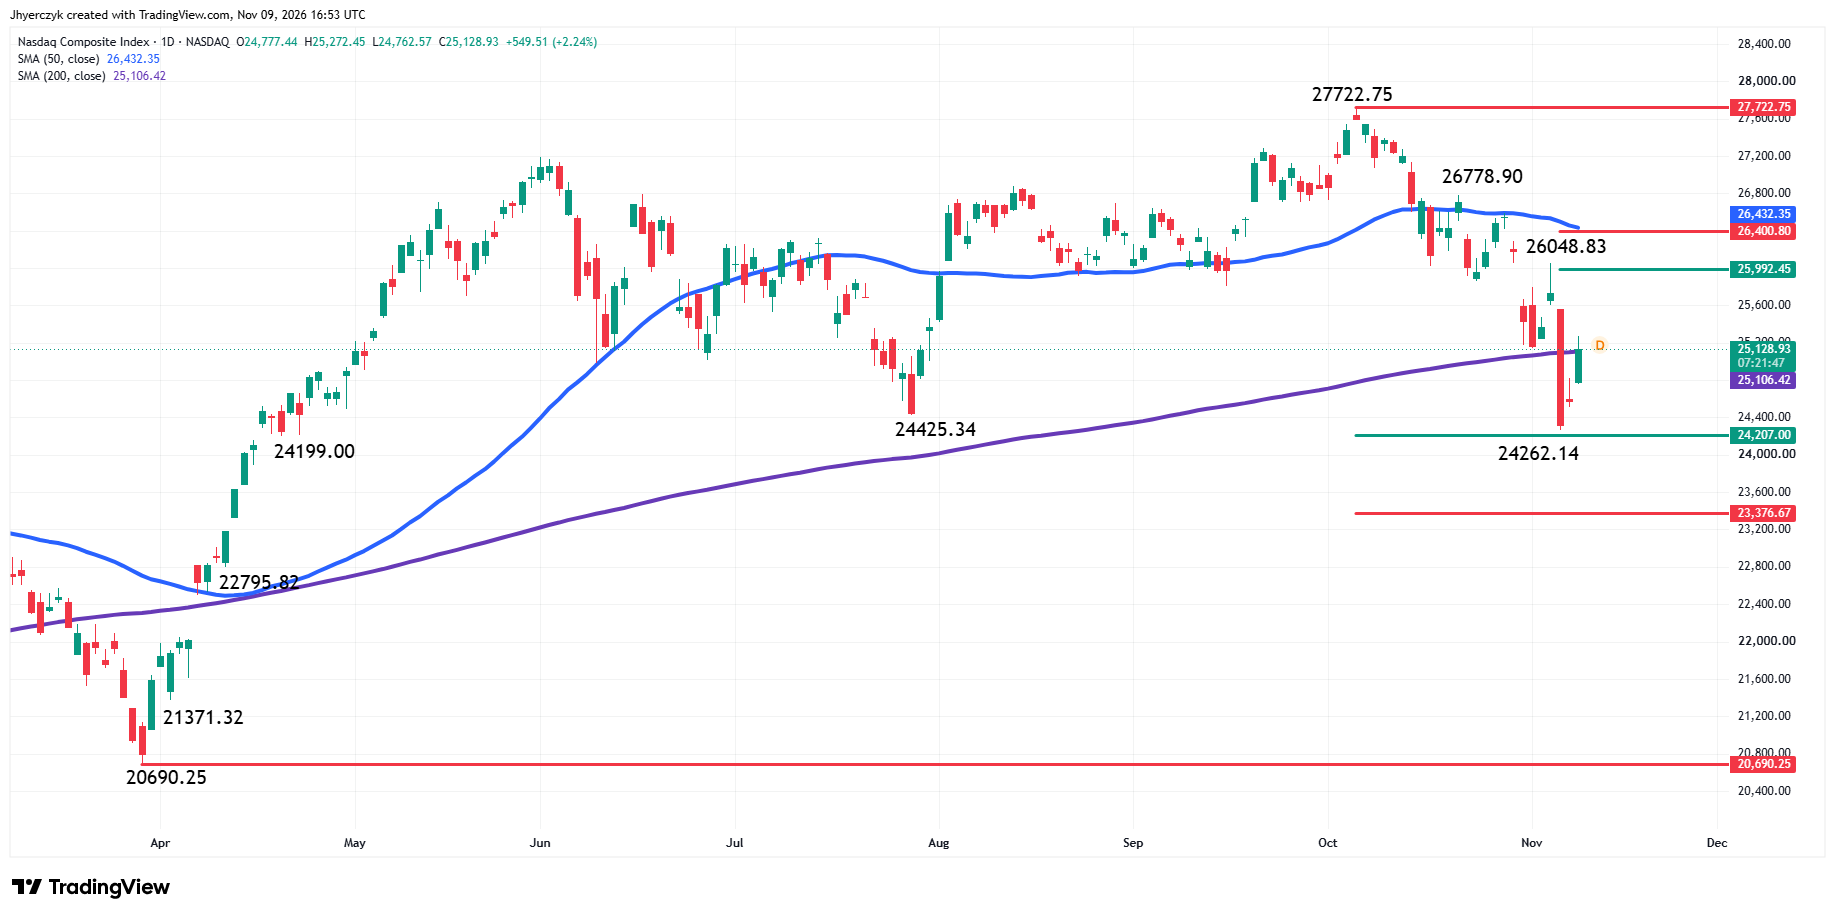
The Nasdaq Composite Index is sharply higher on Monday, but the main trend is down according to the daily swing chart. A trade through 24262.14 will signal a resumption of the downtrend. The main trend will change to up on a move through the last swing top at 26048.83.
The main range is 20690.25 to 27722.75. Its 50% to 61.8% support zone is 24207.00 to 23376.67. Last Thursday’s low at 24262.14 stopped just short of this area.
The new short-term range is 27722.75 to 24262.14. Its retracement zone at 25992.45 to 26400.80 is the next major upside target.
The 200-day moving average is 25106.42 and the 50-day moving average is 26432.35. The latter is forming a potential resistance cluster with the short-term 61.8% level at 26400.80.
What to Watch
Daily S&P Index (SPX)
My bias is to the downside despite today’s strength. My bearish outlook is being driven by the downtrend on the main swing chart. Additionally, gains are likely to be capped by the retracement levels at 7541.19, 7597.44 and 7655.75. The 50-day moving average is also another potential resistance level.
Last week, the index came close to testing the 200-day moving average before hitting a weekly low at 7350.35. Breaking this technical indicator will likely extend the break into the long-term retracement zone at 7080.72 to 6900.46.
Daily Nasdaq Composite Index (IXIC)
My immediate bias is to the downside because of the downtrend on the swing chart and the trade on the weak side of the 50-day moving average. However, the index has recovered the 200-day moving average, which weakens the bearish case.
Today’s price action suggests that trader reaction to the 200-day moving average could determine the near-term direction. A sustained move over this indicator could trigger a surge into the retracement zone at 25992.45 to 26400.80.
A sustained move back under the 200-day moving average will signal the presence of sellers. This could continue to keep pressure on the index, with 24207.00 to 23376.67 the next major objective.
More Information in our Economic Calendar