



The tech-driven Nasdaq Composite Index and the benchmark S&P 500 Index are down sharply late in the session on Thursday. The sell-off erased yesterday’s strong gains that were fueled by the Democrats’ stellar performance in Tuesday’s midterm elections.
On Wednesday, traders were crediting the possibility of government gridlock and a steep drop in oil prices for the rally. However, on Thursday, the possibility of gridlock between a Democratic legislature and a Republican executive branch was still there, oil was lower, and yet prices still plunged.
In my opinion, technology investors decided to book profits and move to the sidelines or cash until there is a clear plan for data-center buildouts. Adding to the fears was the possibility that state-level action could decelerate the data-center buildout. Senator Bernie Sanders of Vermont has called for a national AI data-center moratorium.
According to CNBC, Sanders posted on X.com on Wednesday evening that “Americans don’t want Big Tech oligarchs wrecking the environment, gutting jobs and threatening humanity’s future.”
I think that the initial reaction on Wednesday was a kneejerk move. The election results may have come as a surprise to some major players, who now have to work out new risk parameters before they can move forward. That’s going to take time, so the best move was to reduce exposure today under the guise of “when in doubt, get out.”
Daily Nasdaq Composite Index (IXIC) Technical Analysis
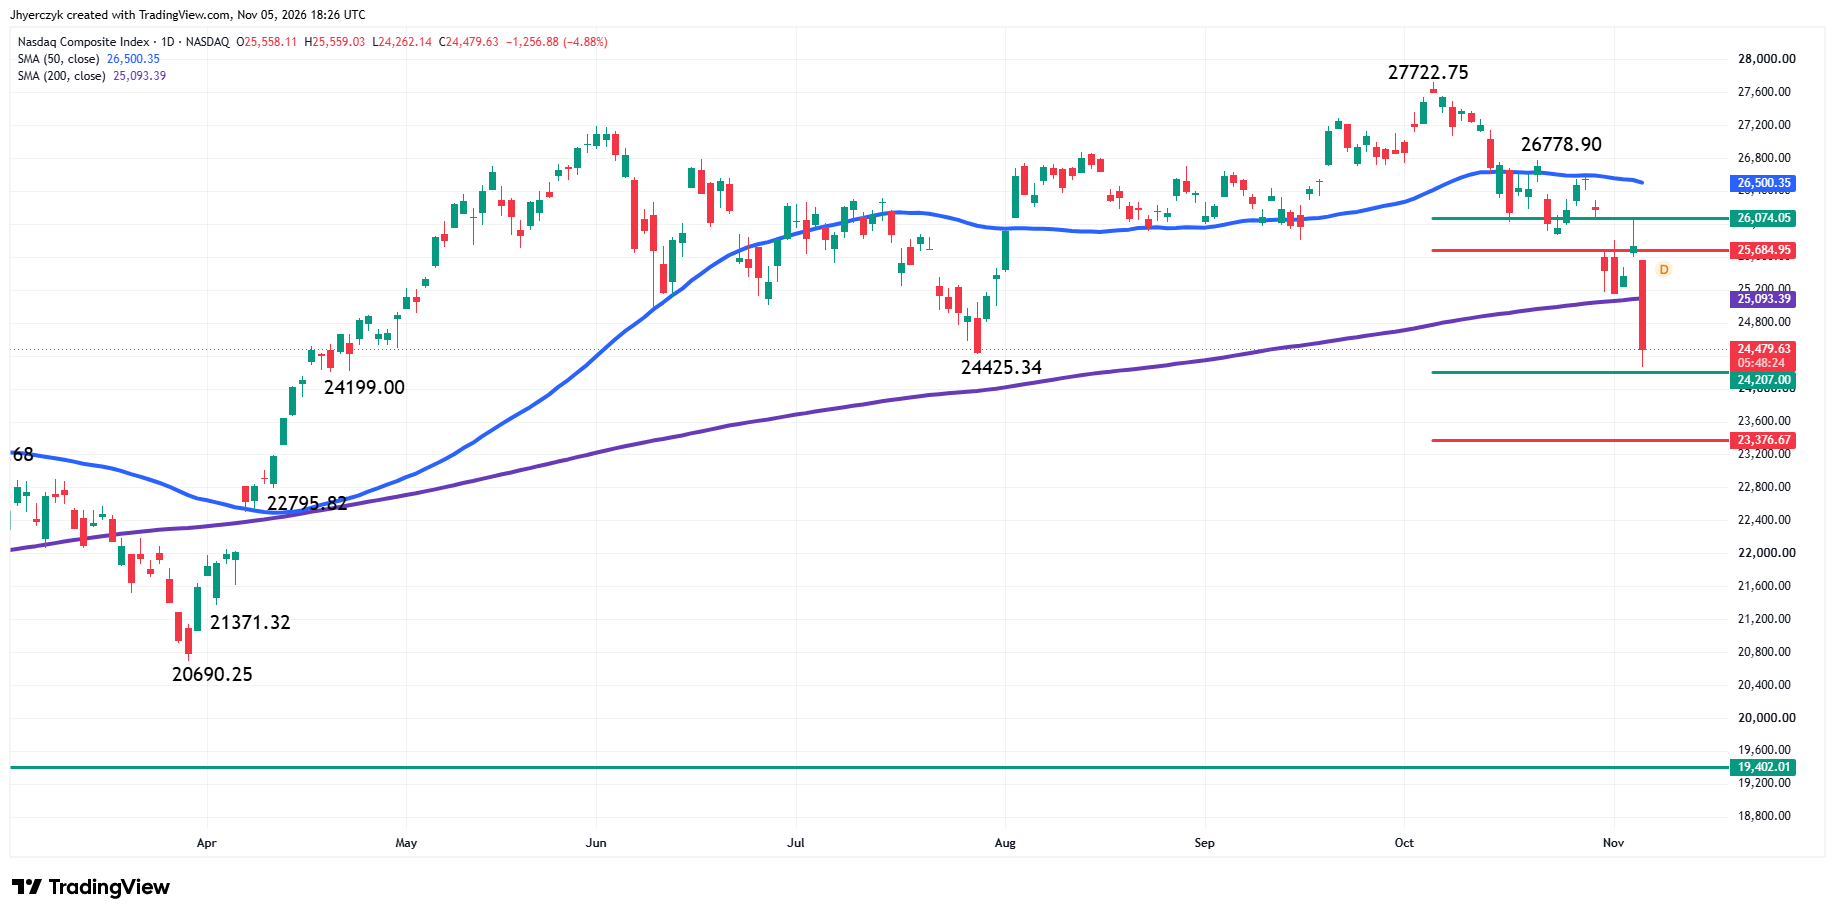
The selling pressure resumed on the Nasdaq Composite (IXIC) Index on Thursday. The main trend is down according to the daily swing chart. It was reaffirmed early in the session when sellers took out the last swing bottom at 25145.95 and the July 29 main bottom at 24425.34. That move actually puts the March 30 main bottom at 20690.25 on the radar.
On the upside, a trade through 26778.90 will change the trend to up. This is followed by the all-time high at 27722.75. I wouldn’t worry too much about the market’s upside potential at this time. The price slide and the bottoming process are more important at this time.
The March 30 to October 6 long-term range is 20690.25 to 27722.75. Its 50% to 61.8% retracement zone is potential support at 24207.00 to 23376.67. We could see a technical bounce or short-covering emerge on the first test of this area, but if it fails, then the index has the potential to plunge about 4000 points toward 19402.01 over the near-term.
The test of today’s low at 24262.14 put the index down 12.48% from its all-time high at 27722.75, putting the index in correction territory. A more than 20% drop from 27722.75 or a test of 22178.20 will put the Nasdaq Composite into bear market territory. A bear market in price will not be bad per se. We’ve experienced steep short-term corrections the past two years and still recovered to make new all-time highs. A bear market in time would be the one to avoid.
Dow Jones Price Forecast
Every new Dow Jones analysis as it publishes, today's technical signal and key levels, live price — on one page.
See all Dow Jones forecastsDaily S&P 500 Index (SPX) Technical Analysis
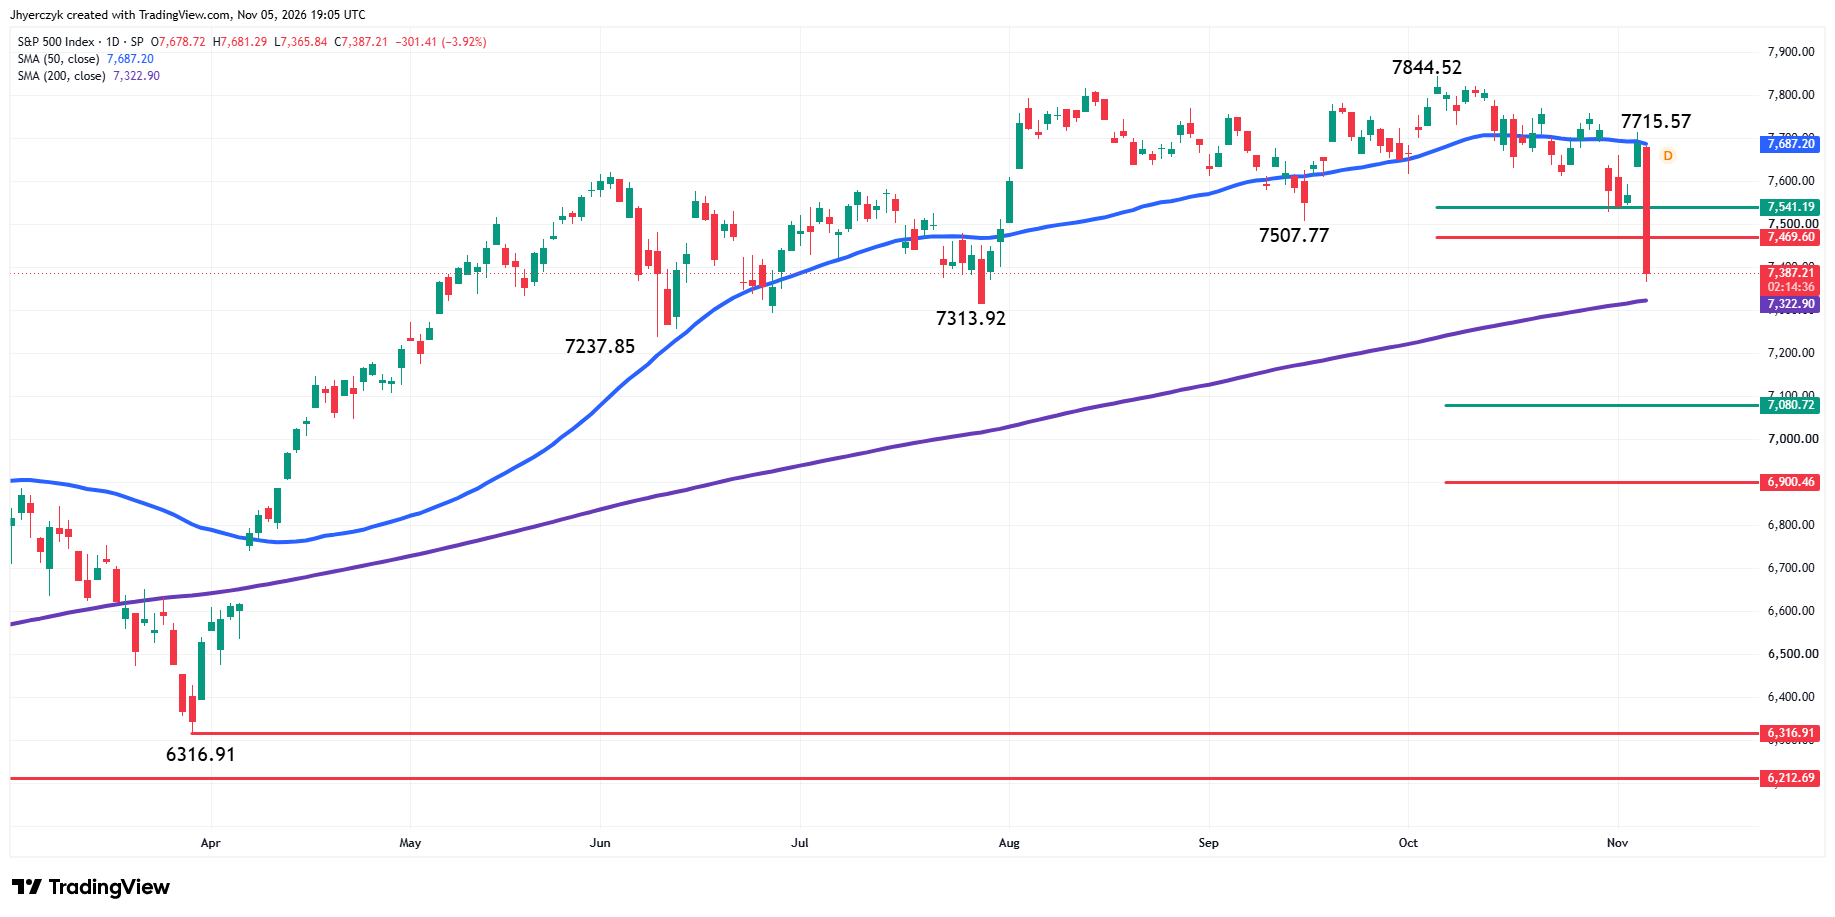
The main trend is down according to the daily swing chart. The series of lower tops and lower bottoms and the recent failures to overcome the 50-day moving average at 7687.20 contributed to the selling pressure. Thursday’s early break to the weak side of the intermediate retracement zone at 7469.60 to 7541.19 also put traders in selling mode.
With a number of independent technical signals lining up, pressure built and prices collapsed. However, the market stopped just above the 200-day moving average at 7322.90 and the July 29 main bottom at 7313.92, leaving both levels as support.
The long-term range, which began on March 30 at 6316.91 and peaked at 7844.52 on October 6, has produced a retracement zone at 7080.72 to 6900.46. This area is a potential downside target.
What to Watch
Nasdaq Composite Index (IXIC)
The trade through the 200-day moving average at 25093.39 has strengthened my downside bias, which began on the 50-day moving average breakdown around October 15, and the lower bottoms and lower tops on the daily swing chart.
I will be paying attention to the price action on a test of the retracement zone support at 24207.00 to 23376.67. I wouldn’t be surprised by a technical bounce back into the 200-day moving average. If it’s rejected at the 200-day moving average, then the selling pressure could intensify enough to take out the 61.8% level at 23376.67. This would open the door for a plunge to 22178.20, which would put us in bear market territory, then 20690.25, which is the 2026 low so far.
S&P 500 Index (SPX)
I’m going to keep my analysis clean and only deal with the bigger picture. My bias is to the downside. The main swing chart and the trade under the 50-day moving average support my outlook.
A trade through the swing bottom at 7313.92 will reaffirm the downtrend. Overcoming 7715.57 will change the main trend to up. Recapturing the 50-day moving average at 7687.20 will also dampen my bearish tone.
On the downside, a sustained move under the 200-day moving average at 7322.90 will indicate a shift in long-term sentiment and put the S&P 500 Index in a position to weaken further. That would make the major retracement zone at 7080.72 to 6900.46 the next target for a potential technical bounce.
More Information in our Economic Calendar.