Advertisement
Advertisement
Natural Gas Price Fundamental Daily Forecast – Consolidating with Technical Factors Driving the Price Action
By:
The major supply/demand fundamentals are bearish, but there are a few short-term events that are encouraging some of the weaker shorts to cover.
Natural gas futures are nearly flat after giving up earlier gains on Wednesday. The price action suggests traders may be trying to form a support base, but so far all we are seeing is some light short-covering. There is no evidence of buying yet. Prices are definitely in oversold territory but this doesn’t mean the trend has to change.
On Tuesday, natural gas futures surged a little more than 5% to a one-week high on Tuesday as short-sellers took profits for a second session after prices dropped to a 25-month low last Friday.
At 12:11 GMT, April natural gas is trading $2.661, down 0.003 or -0.11%. On Tuesday, the United States Natural Gas Fund ETF (UNG) settled at $8.86, up $0.36 or +4.24%.
Long-Term Bearish, but Vulnerable to Short-Covering Rally Over Near-Term
The major supply/demand fundamentals are bearish, but there are a few short-term events that are encouraging some of the weaker shorts to take profits and cover their positions. The most important is the drop in production. As of Tuesday, output remains lower than last month following recent extreme cold that froze oil and gas wells in several producing basins.
Refinitiv said average gas output in the U.S. Lower 48 states fell to 95.7 billion cubic feet per day (bcfd) so far in February, down from 98.3 bcfd in January. That compares with a monthly record of 99.8 bcfd in November 2022.
Freeport LNG Not a Factor Yet
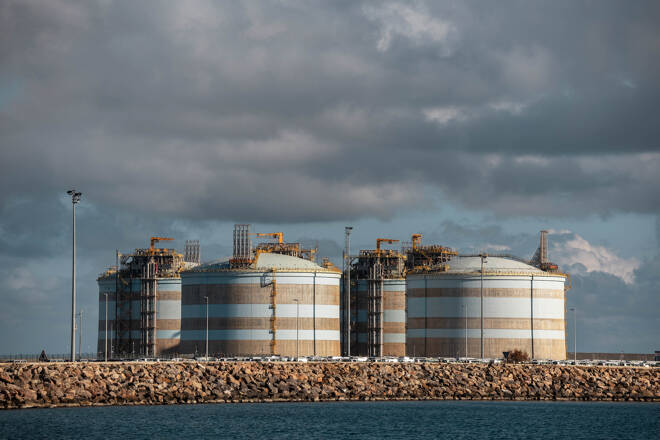
Another event that traders are watching is the growing belief that Freeport LNG’s export plant in Texas would soon start pulling in a lot more gas in coming weeks once it starts producing liquefied natural gas (LNG) for export.
However, the market still isn’t sure when Freeport LNG will come back on line. Once it starts operating at full power, which could be in Mid-March by some estimates, Freeport can turn about 2.1 billion cubic feet or gas into LNG each day. That is about 2% of total U.S. daily gas production.
Some Weather Demand but Not Enough to Fuel a Rally
According to NatGasWeather, “While national demand will be extremely light most of the next 11-days, much of the weather data is forecasting a colder pattern Feb. 17-20 as frosty air sweeps across the U.S.
Although, this isn’t likely the reason for the strength this week and likely more about technically oversold conditions after 6-weeks of heavy selling or due to the supply/demand balance tightening the past few weeks.
Short-Term Outlook
Technically, the main trend is down. A trade through $2.416 will signal a resumption of the downtrend.
The nearest main top is $2.836. Traders may be gunning for this main top in order to trigger buy stops. The pattern is likely to repeat if the next main top at $3.256 is taken out in a similar manner.
Taking out tops and trigger buy stops is not bullish. It only serves to take out the weaker shorts. Higher-tops and higher-bottoms are necessary to form a good uptrend. We’re only three days up from a 25-month low so it’s going to take some time to form a sold bottom. In the meantime, be careful chasing upside breakouts.
For a look at all of today’s economic events, check out our economic calendar.
About the Author
James Hyerczykauthor
James Hyerczyk is a U.S. based seasoned technical analyst and educator with over 40 years of experience in market analysis and trading, specializing in chart patterns and price movement. He is the author of two books on technical analysis and has a background in both futures and stock markets.
Advertisement
