


US10Y Technical Analysis
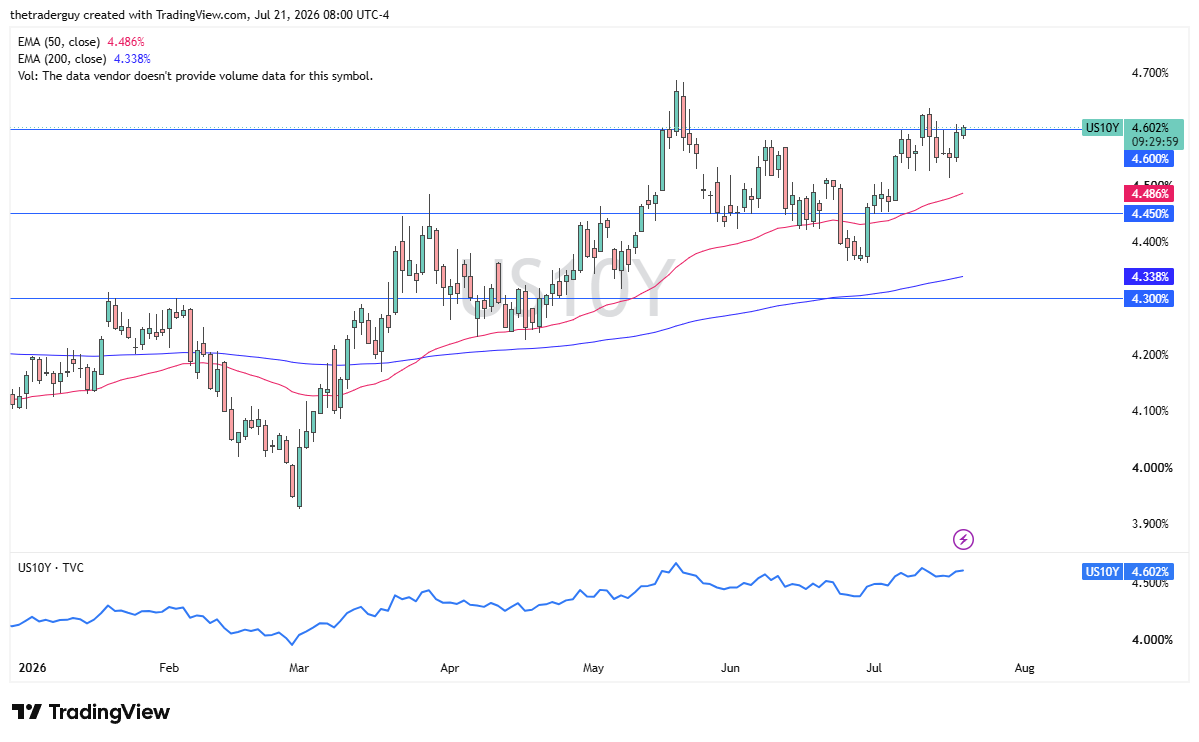
The US 10-year yield is rising slightly after initially dipping at the open. It’s not a huge surprise because, quite frankly, we still have all of those issues out there when it comes to the idea of energy inflation. I don’t see yields dropping very drastically anytime soon. Anytime we have seen it happen, it turned right back around. I think yields are going to be sticky. Right here at the 4.6% area for the 10-year yield seems to be an area that we like to revisit.
EUR/USD Technical Analysis
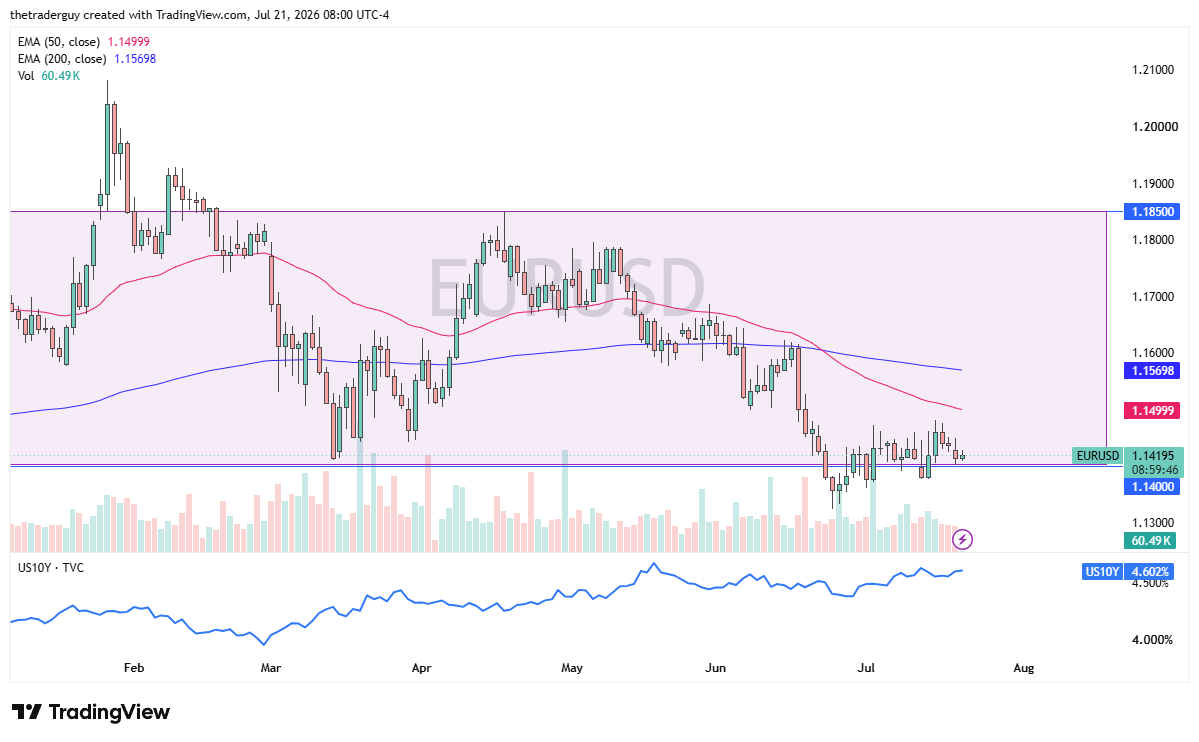
With that in mind, it’s not a huge surprise to see that the Euro is giving back some of its initial gains, and I think, ultimately, we do break down. However, I don’t necessarily think we do it today. So what I’m looking for is little micro movements on the short-term charts, little bumps that I can start shorting into. You can see it just happened here on the 15-minute chart. I do think eventually it is a situation that we do break much lower, but right now, I’m just playing what the market gives me, and right now what the market is giving me are 20 pip opportunities to short.
USD/SGD Technical Analysis
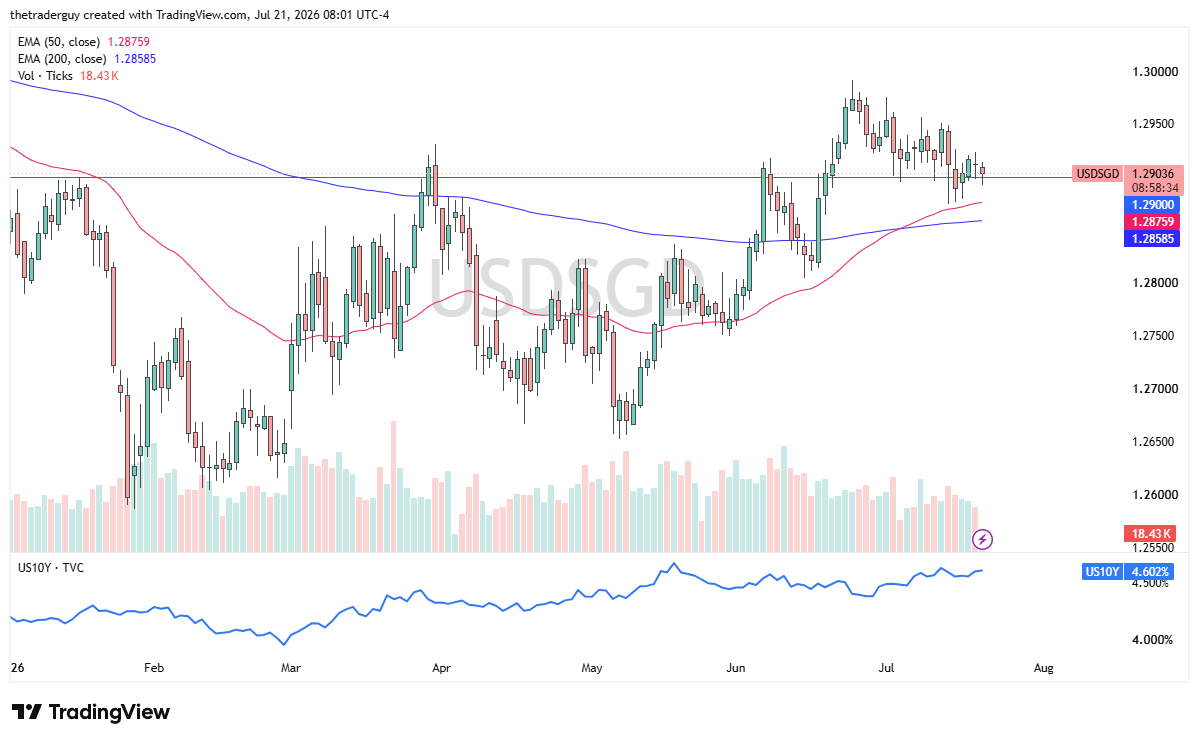
The US Dollar against the Singapore Dollar is something I’m watching as well. We’re right here at the 1.29 level. I do think that we’re starting to see a little bit of support here. The 50-day EMA is just 25 pips underneath, and this is an area that previously had been resistance, so I’m looking to buy this, looking to get about 50 pips out of it. It’s not so much a day trade; this could honestly take 2 or 3 days pretty quickly. But it’s a setup I saw; it’s something I’m definitely looking to get involved in.
Platinum Technical Analysis
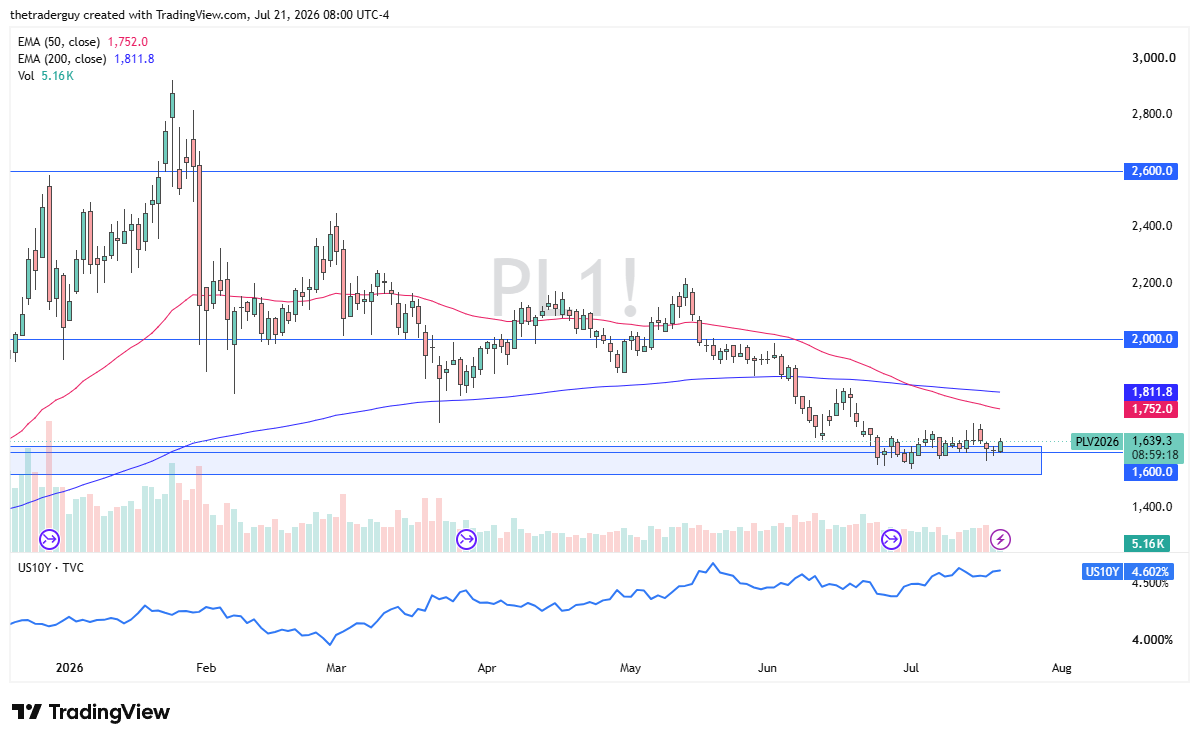
Finally, Platinum has been fairly strong early in the day. I’m looking to step on this thing as it will almost certainly show weakness sooner or later. I’ll probably go down to something like the 15-minute chart, start paying attention near the $1,675 region where we’ve seen some trouble in the past. We’ll just have to see how that plays out, but that’s something I’m watching for maybe later in the day; we’ll just see. Or if we start to see selling momentum pick up, I might just join there. But either way, I have no interest in buying Platinum, at least not at the moment. Longer-term, I like it, but right now there are too many things working against it in the form of interest rates and the conflict in the Middle East.