



The Dow Jones Industrial Average has broken above 50,000 following four weeks of price compression. This breakout confirms the broader recovery across the U.S. stock market. The S&P 500 also broke 7,000 in April after recovering in a V-shape and is now on course for 8,000 in the next few weeks. I think this rally indicates that the risk appetite is gaining momentum in the short term, while gold (XAU) is consolidating at the support zone. This article discusses why stocks are rising despite inflation and war risks, how liquidity and AI spending are facilitating the move and why stock-to-gold ratios still matter for the next big shift in gold.
U.S. Stock Market Breakout Gains Momentum
S&P 500 Breakout Opens the Path to 8,000
The U.S. stock market has surged in April and May, as seen in the chart below. The daily chart for the S&P 500 shows that the index has formed a V-shaped recovery pattern above 6,200 and broke the 7,000 level. After the breakout, the index has opened the door for a surge to the 8,000 level during the next few weeks.
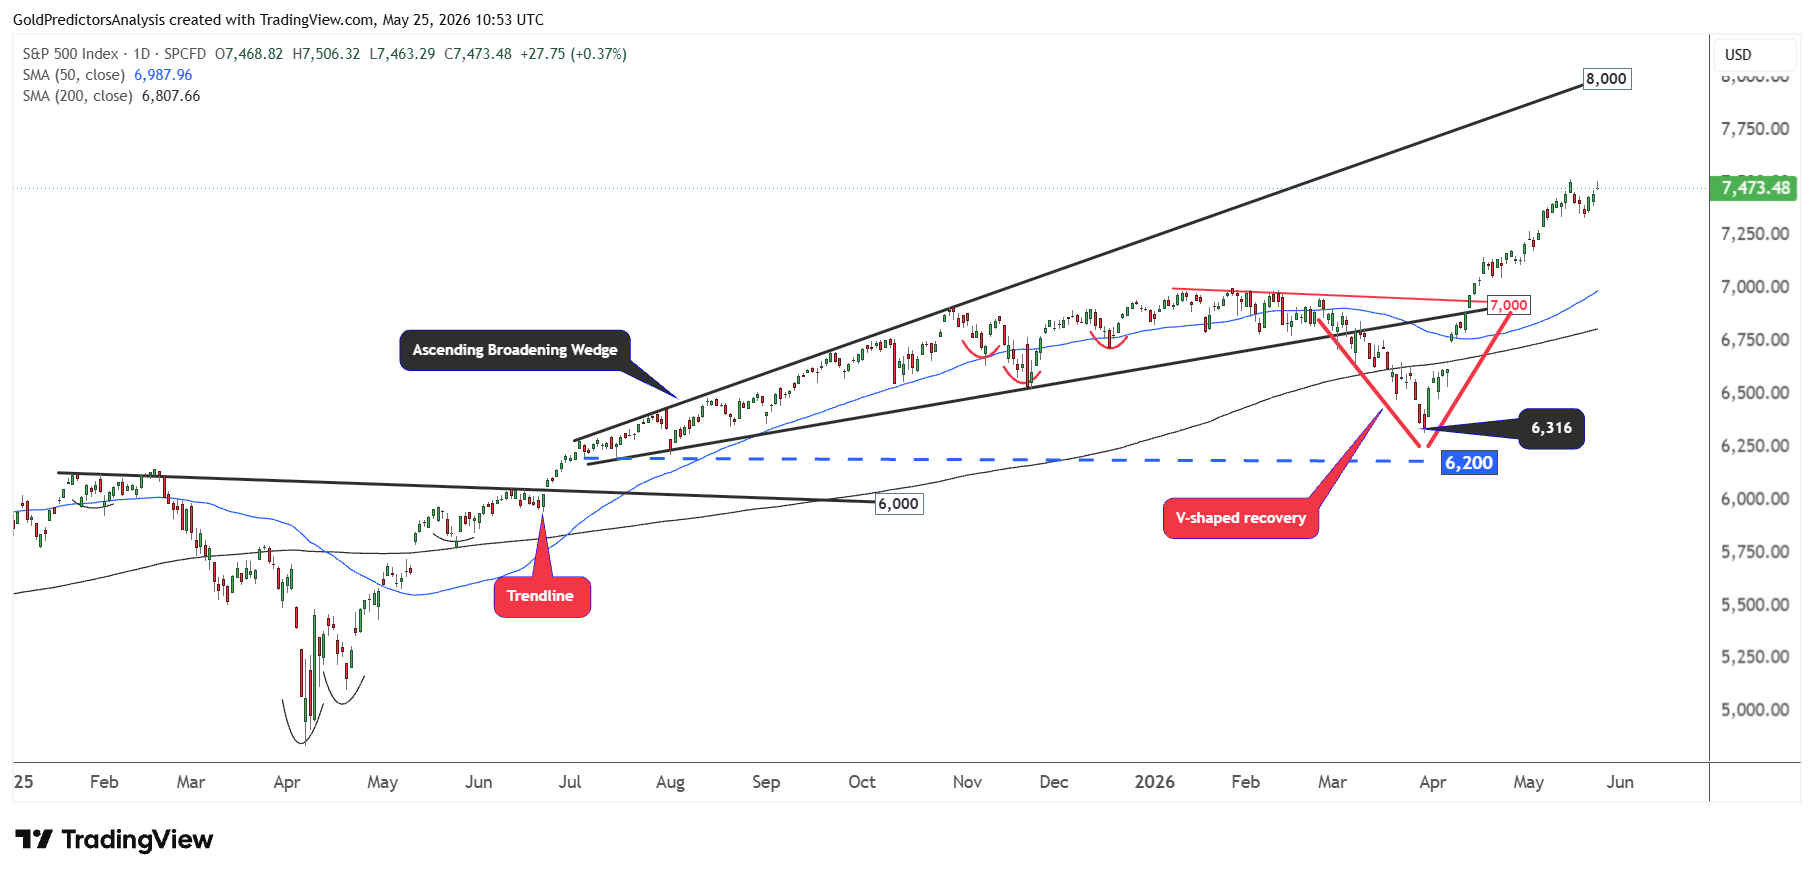
The formation of a V-shaped recovery pattern and the emergence of an ascending broadening wedge indicate that the S&P 500 remains in healthy uptrend and is poised to move higher.
Dow Jones Breaks 50,000 and Confirms Broad Market Strength
The surge in the U.S. stock market is further confirmed by the Dow Jones Industrial Average, which broke the key level of 50,000 after consolidating for the past four months.
Gold Price Forecast
Every new Gold analysis as it publishes, today's technical signal and key levels, live price — on one page.
See all Gold forecasts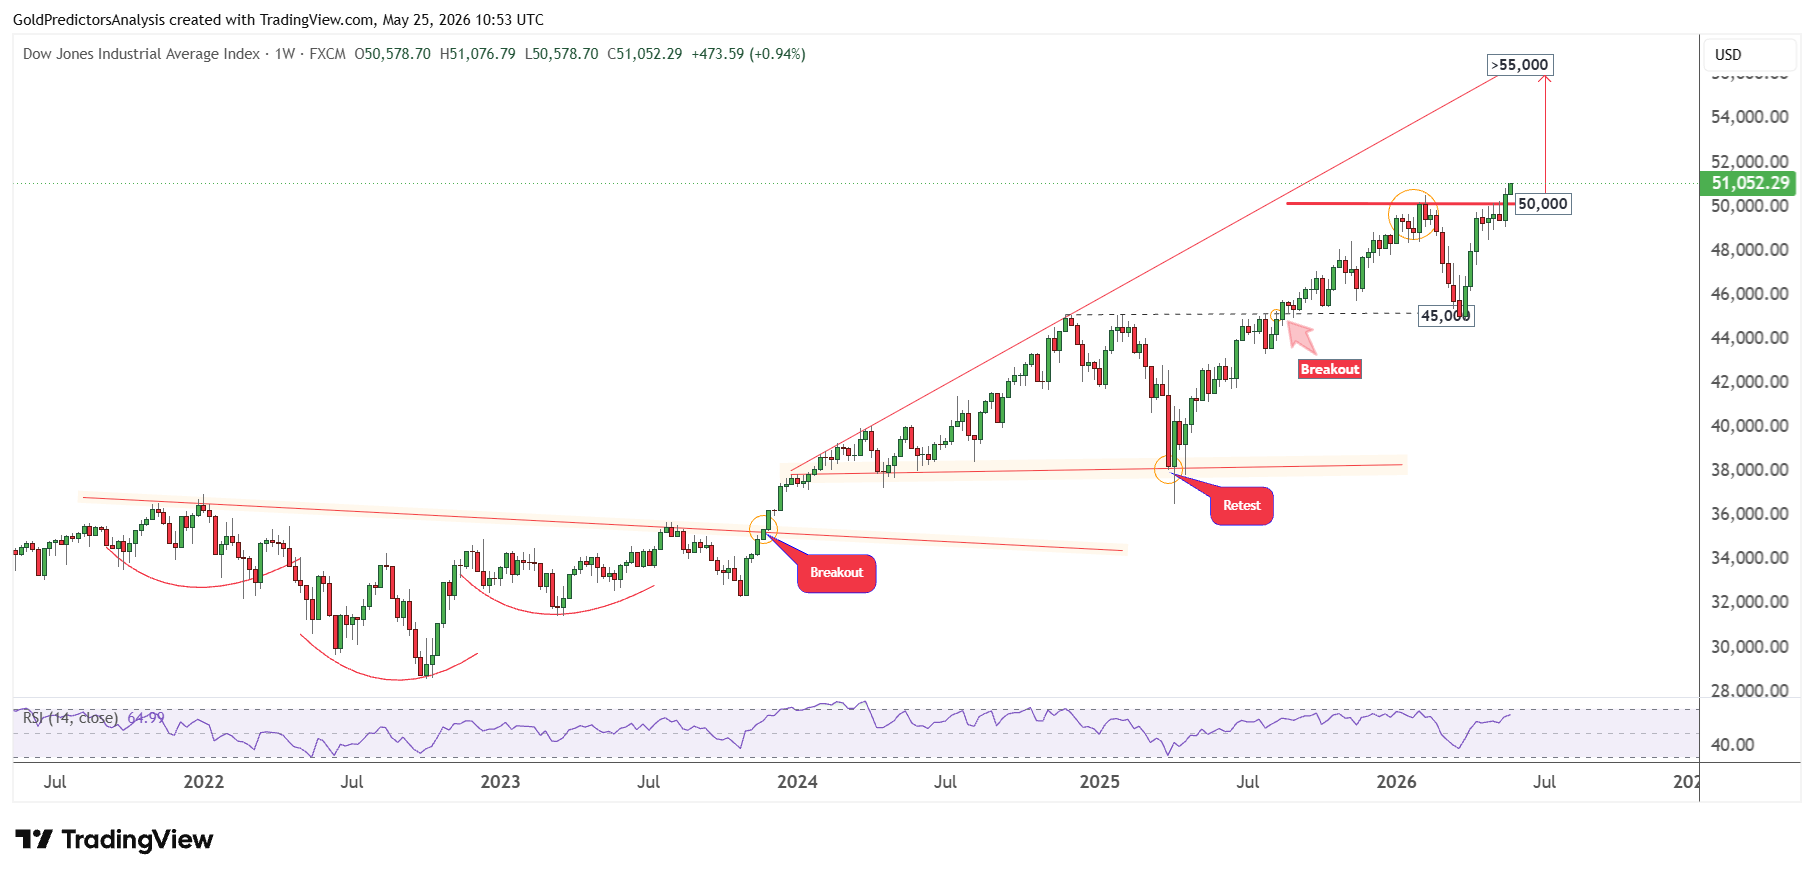
The breakout from the 50,000 level indicates a strong move towards the 55,000 area, which is defined by the resistance of the ascending broadening wedge pattern. The emergence of an inverted head and shoulders pattern from 2022 to 2024 followed by the formation of an ascending broadening wedge pattern, indicates strong bullish momentum in the broader sectors of the US stock market.
Why U.S. Stocks Are Rising Despite Inflation and War Risks
The latest stock market surge is supported by many forces. The tax cuts from Big Beautiful Bill have increased the fiscal support. The core inflation remains above 2% target and the unemployment rate stayed below 5%. But the Federal Reserve has moved towards an easier policy.
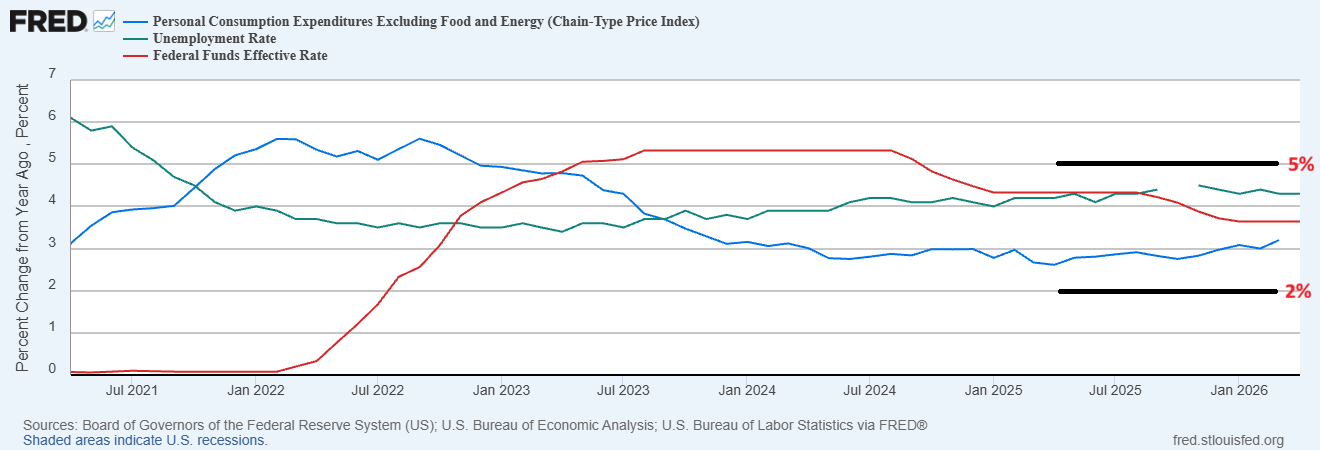
This is important because the Fed has two mandates. The Fed must keep inflation stable and support full employment. When unemployment is already low and inflation is still above target, the rate cuts can add fuel to the financial markets and keep inflation pressure alive.
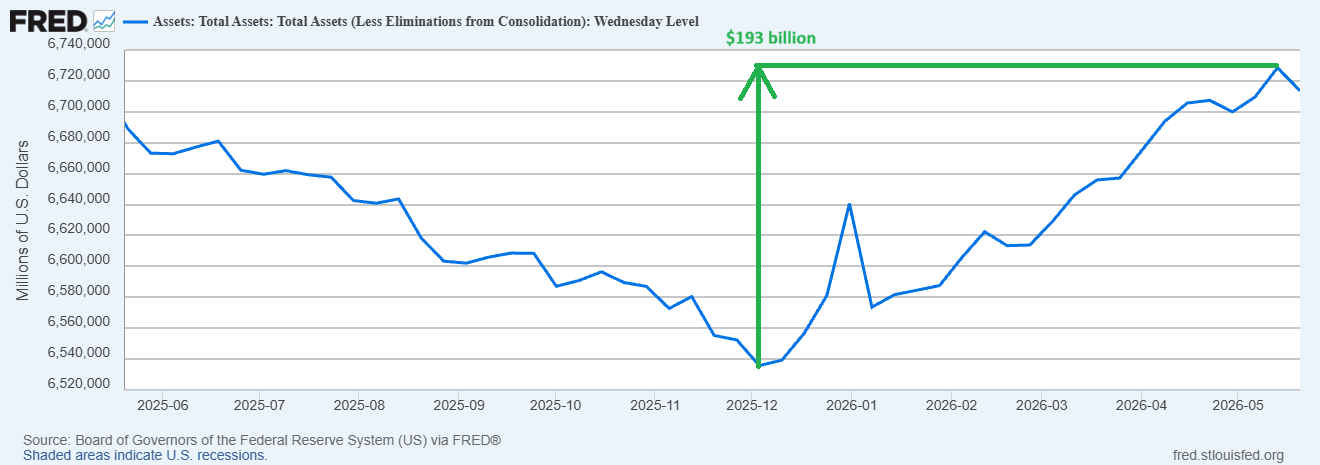
The liquidity has also improved. The chart below shows that the Fed added $193 billion of liquidity to the financial markets since December 2025 to expand the balance sheet.
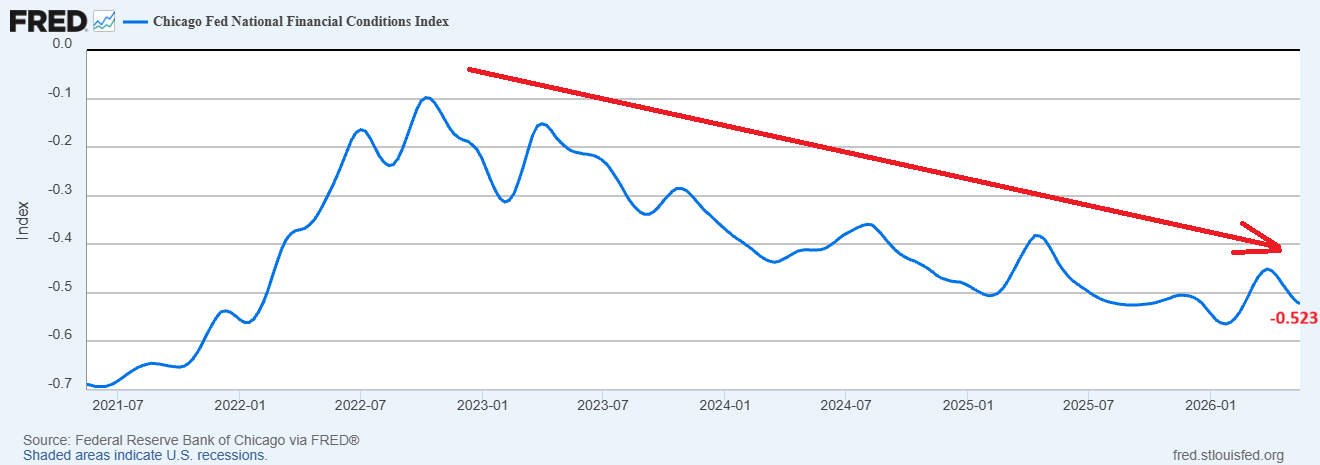
The Chicago Fed National Financial Conditions Index also continued to decline over the past 3 years. This decline indicates easier financial conditions across the system.
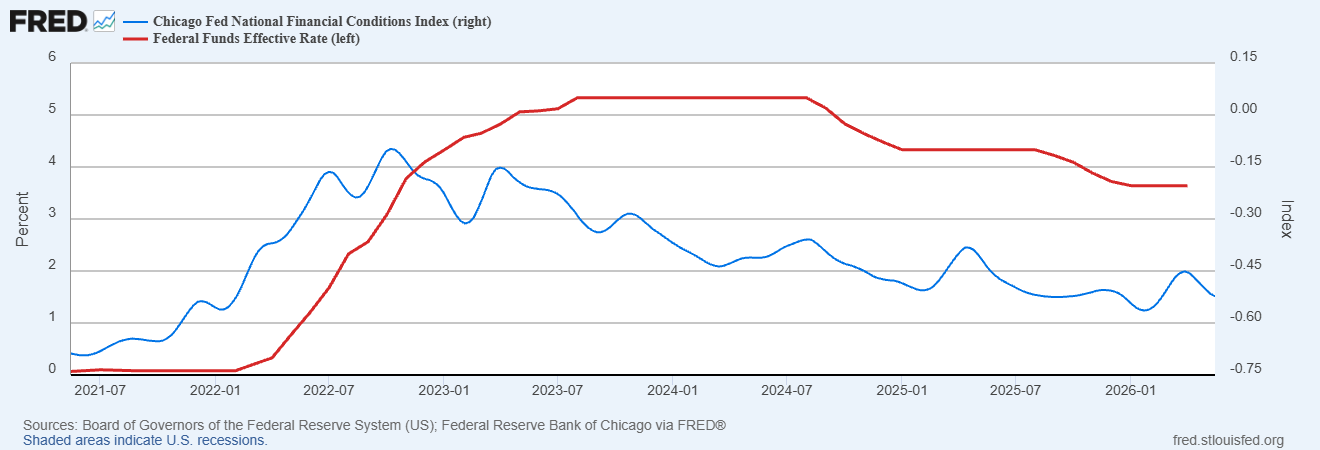
The easing interest rate since 2023 is the prime reason for easy liquidity as seen in the chart below.
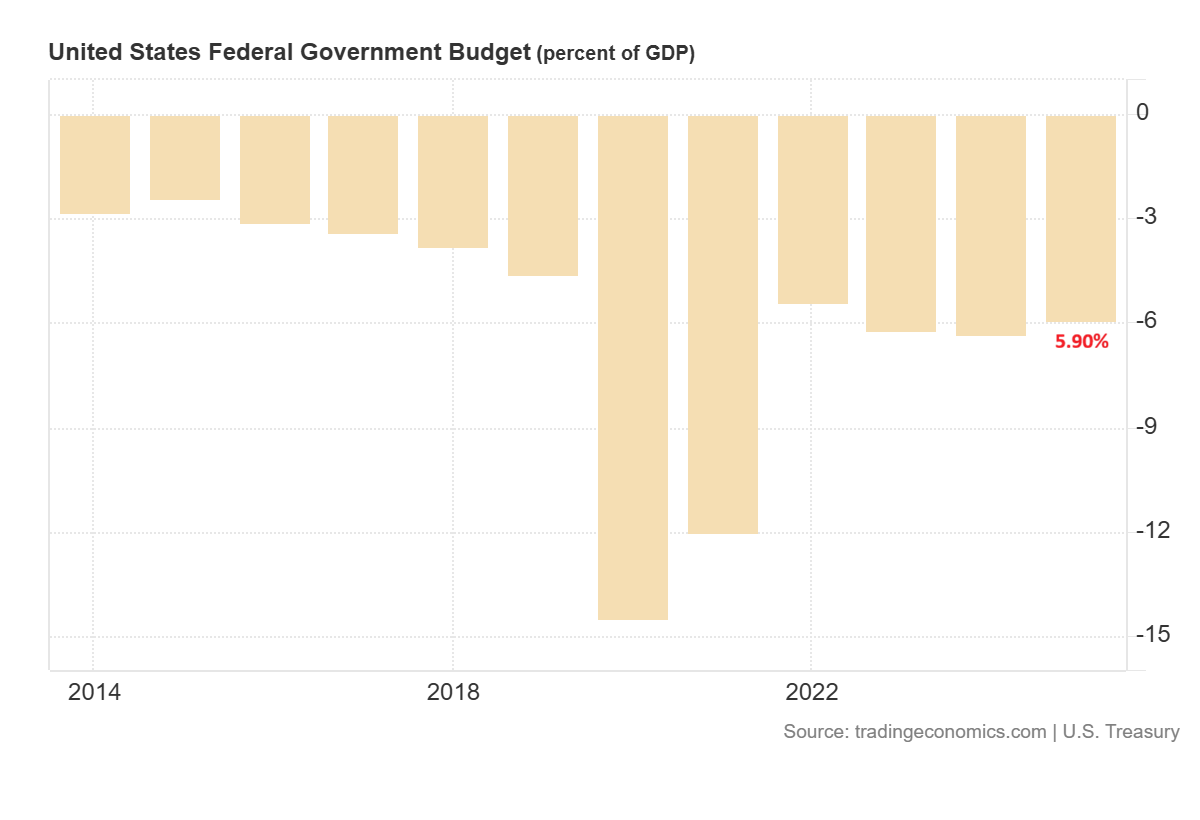
The fiscal policy is also loose. The budget deficit is expected to exceed 6% of GDP in 2026 as shown in the chart below. It is difficult to control the spending before the November midterm elections. The fiscal gap remains large despite the supreme court overturned tariffs.
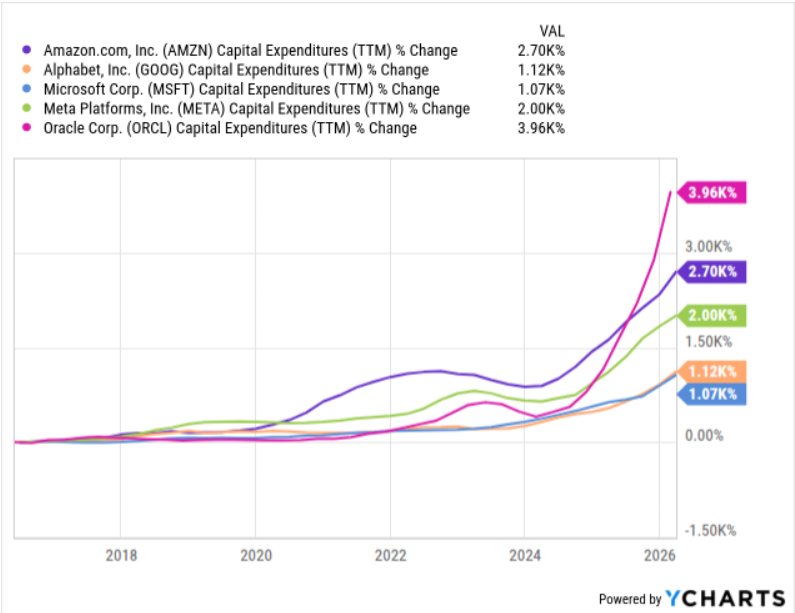
The major driver is the AI spending as seen by the capital expenditures of the large AI companies in the US. This spending has contributed to huge GDP growth. This indicates that the economy is heavily dependent on one growth engine which supports the stock market today. But this dependency increases the concentration risk.
Amazon.com Inc. (AMZN), Alphabet Inc. (GOOG), Microsoft Corp. (MSFT), Meta Platforms Inc. (META) and Oracle (ORCL) have shown a strong surge in AI spending during the past three years.
On the other hand, the war spending adds another layer. The war with Iran is costing more than $1 billion per day. These huge costs create additional fiscal pressure at a time when debt, deficits and interest costs are already rising.
Stocks Outperform Gold as Risk Appetite Returns
The surge in the U.S. stock market has reversed the S&P 500-to-gold ratio from the long-term downtrend and back above the 1.60 region after the U.S.-Iran war.
This rebound in the ratio developed as the U.S.-Iran war triggered a sharp rise in U.S. Treasury yields and the U.S. dollar index. This surge in Treasury yields pushed the gold price under pressure which supported the rally in the index.
Overall, the long-term price structure in the S&P 500-to-gold ratio is still in favour of capital rotation towards gold. This indicates that the surge in US stocks can only put short-term pressure on gold but the long-term picture still remains bullish.
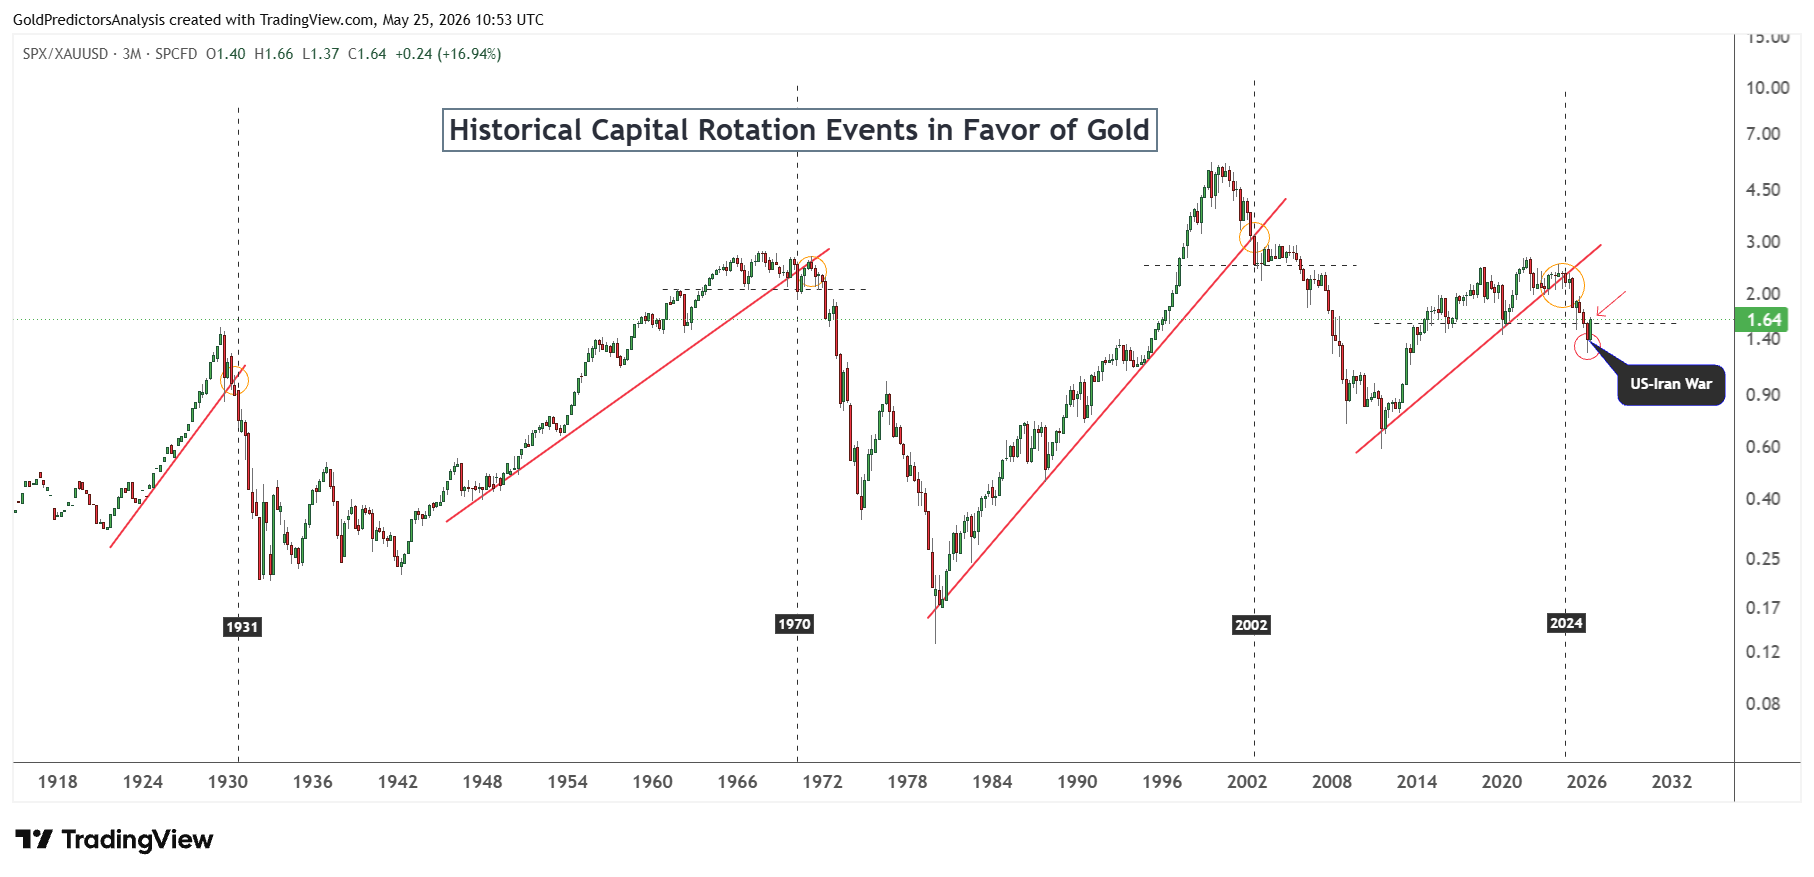
The chart highlights that major rotations occurred in 1931, 1970, 2002 and 2024. The gold prices have surged by a big margin during these rotation events.
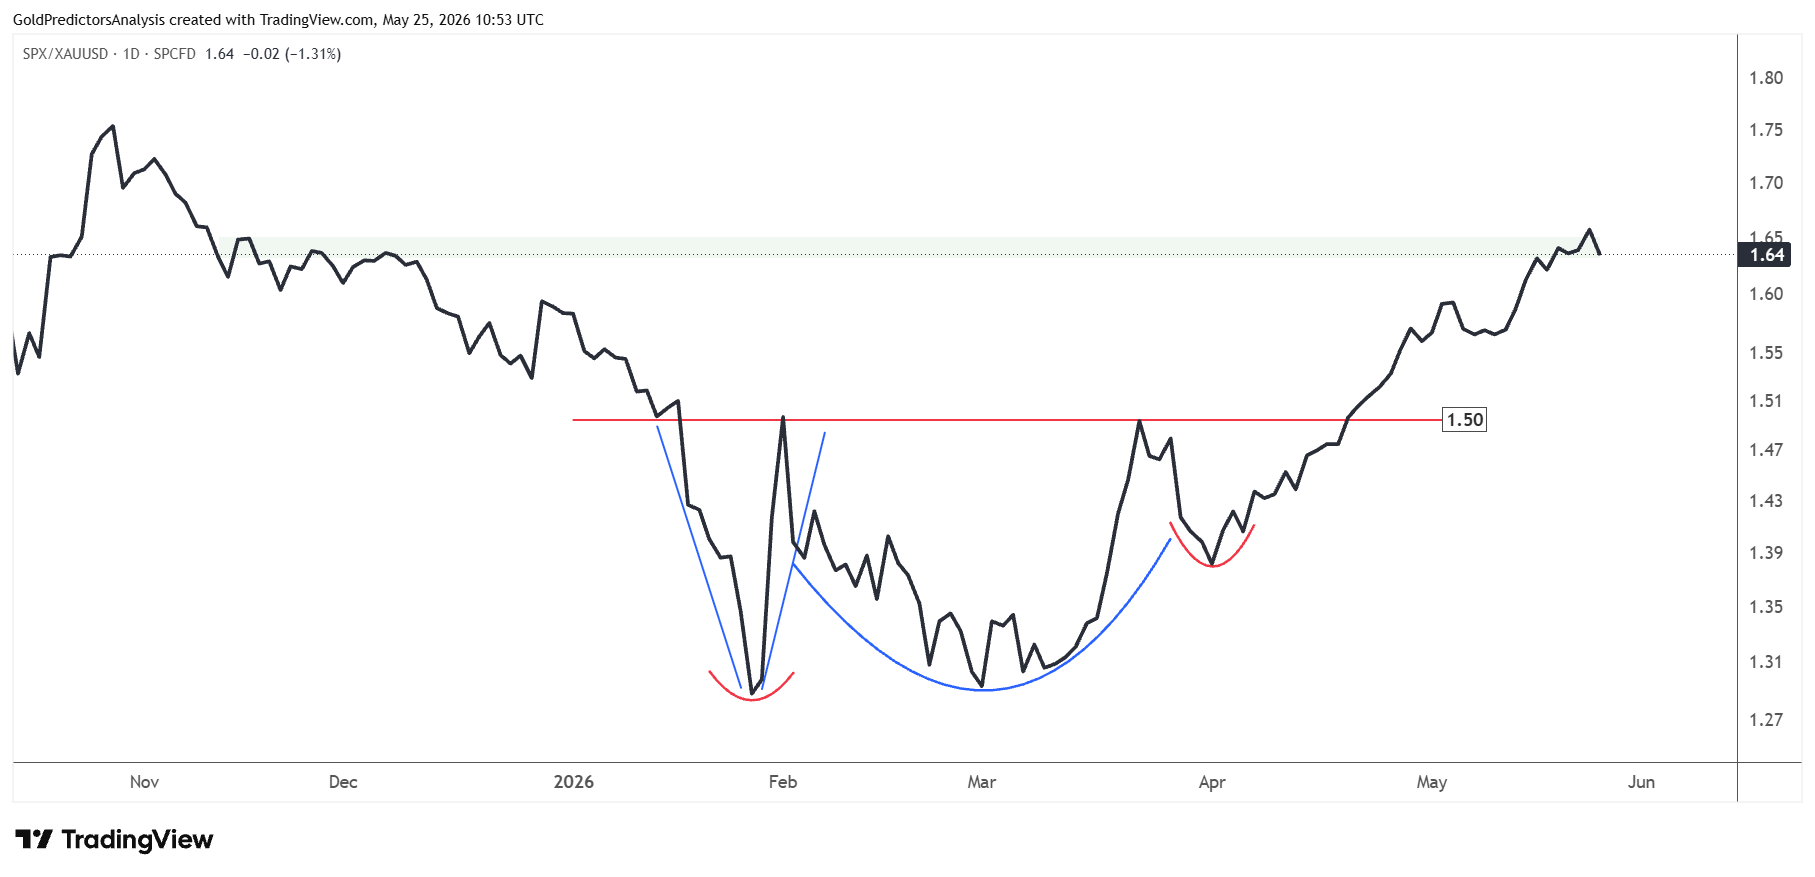
The rebound in the S&P 500-to-gold ratio is evident on the daily chart. The chart shows that the rebound was very constructive above the 1.27 support level.
This rebound has formed a type of Adam and Eve pattern below 1.50, then broke the 1.50 level. This breakout suggests continued upside in the short term.
The ratio has already reached 1.64. But the bigger picture is still negative, as this is only the first quarter of a rebound from the 1.27 level after consecutive quarters of decline.
Gold to S&P 500 Ratio Keeps the Long-Term Gold View Alive
A similar structure is observed in the gold-to-S&P 500 ratio, which hit the strong resistance of the triangle at the 0.77 level.
After hitting this resistance, the ratio continued to drop towards the red dotted trend line at 0.60. The strong support in the ratio remains at 0.60 and 0.45, where the ratio will likely find a bottom and continue higher during the next gold surge.
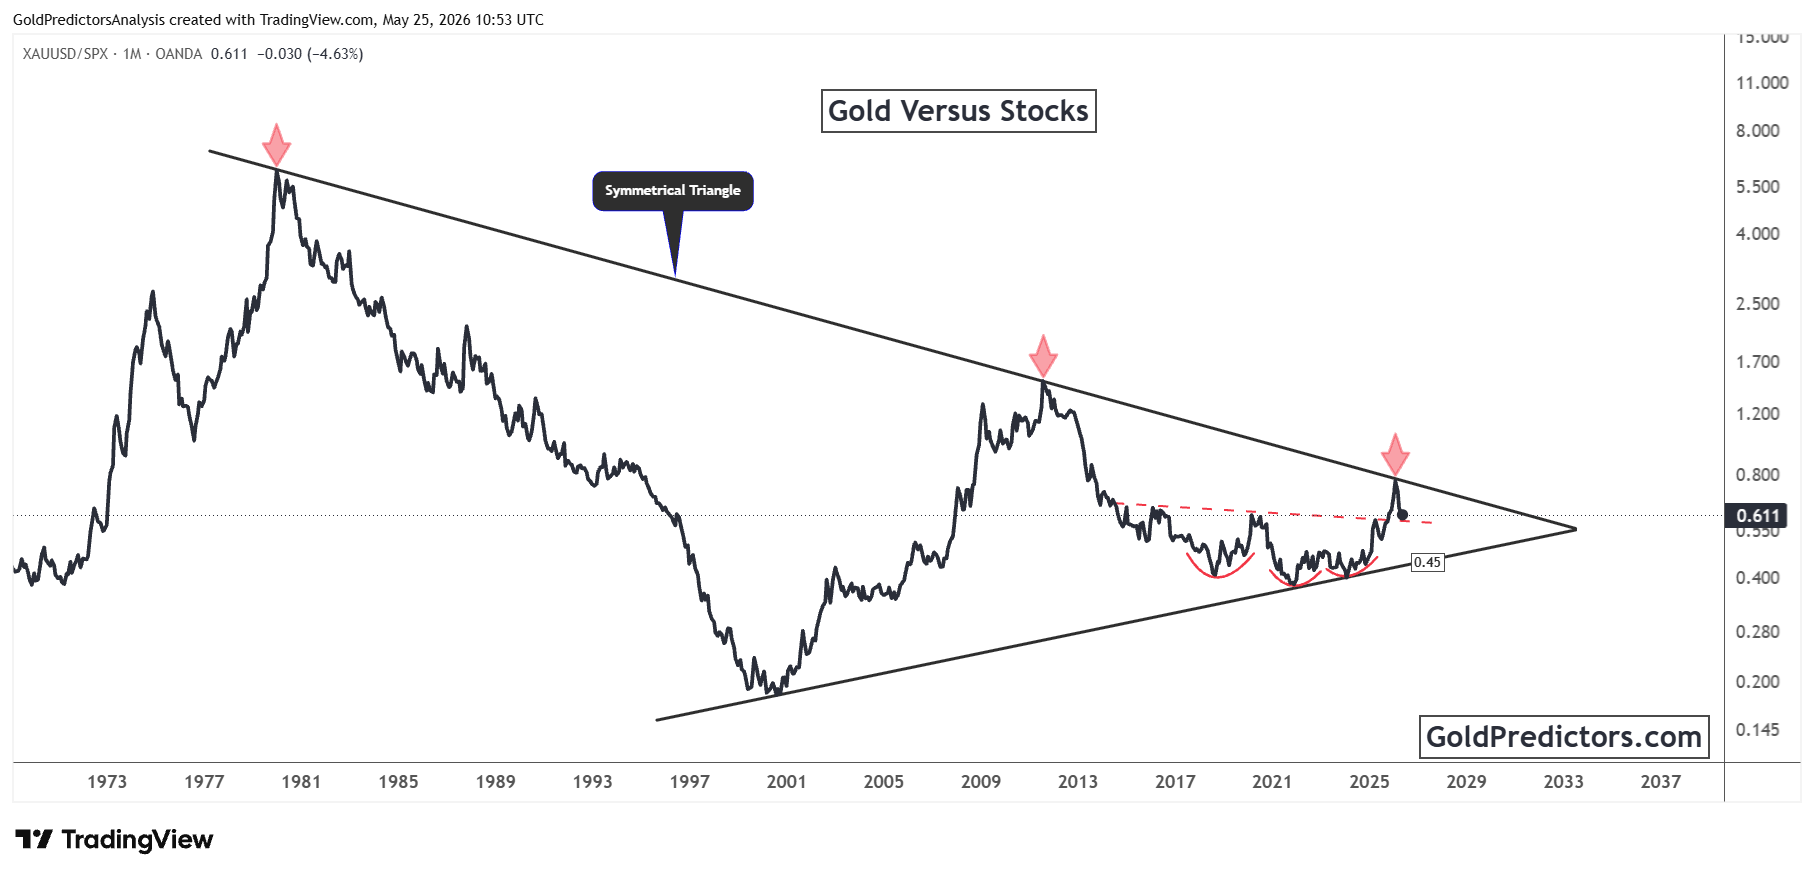
The ratio is required to break above the 0.77 level to trigger a strong surge in gold prices. The overall structure and formation of the bottom patterns from 2015 to 2020 suggest bullish outlook for gold. But the short-term capital rotation from gold to U.S. stocks is pushing the index lower. Gold will again become the inflation hedge during the next phase.
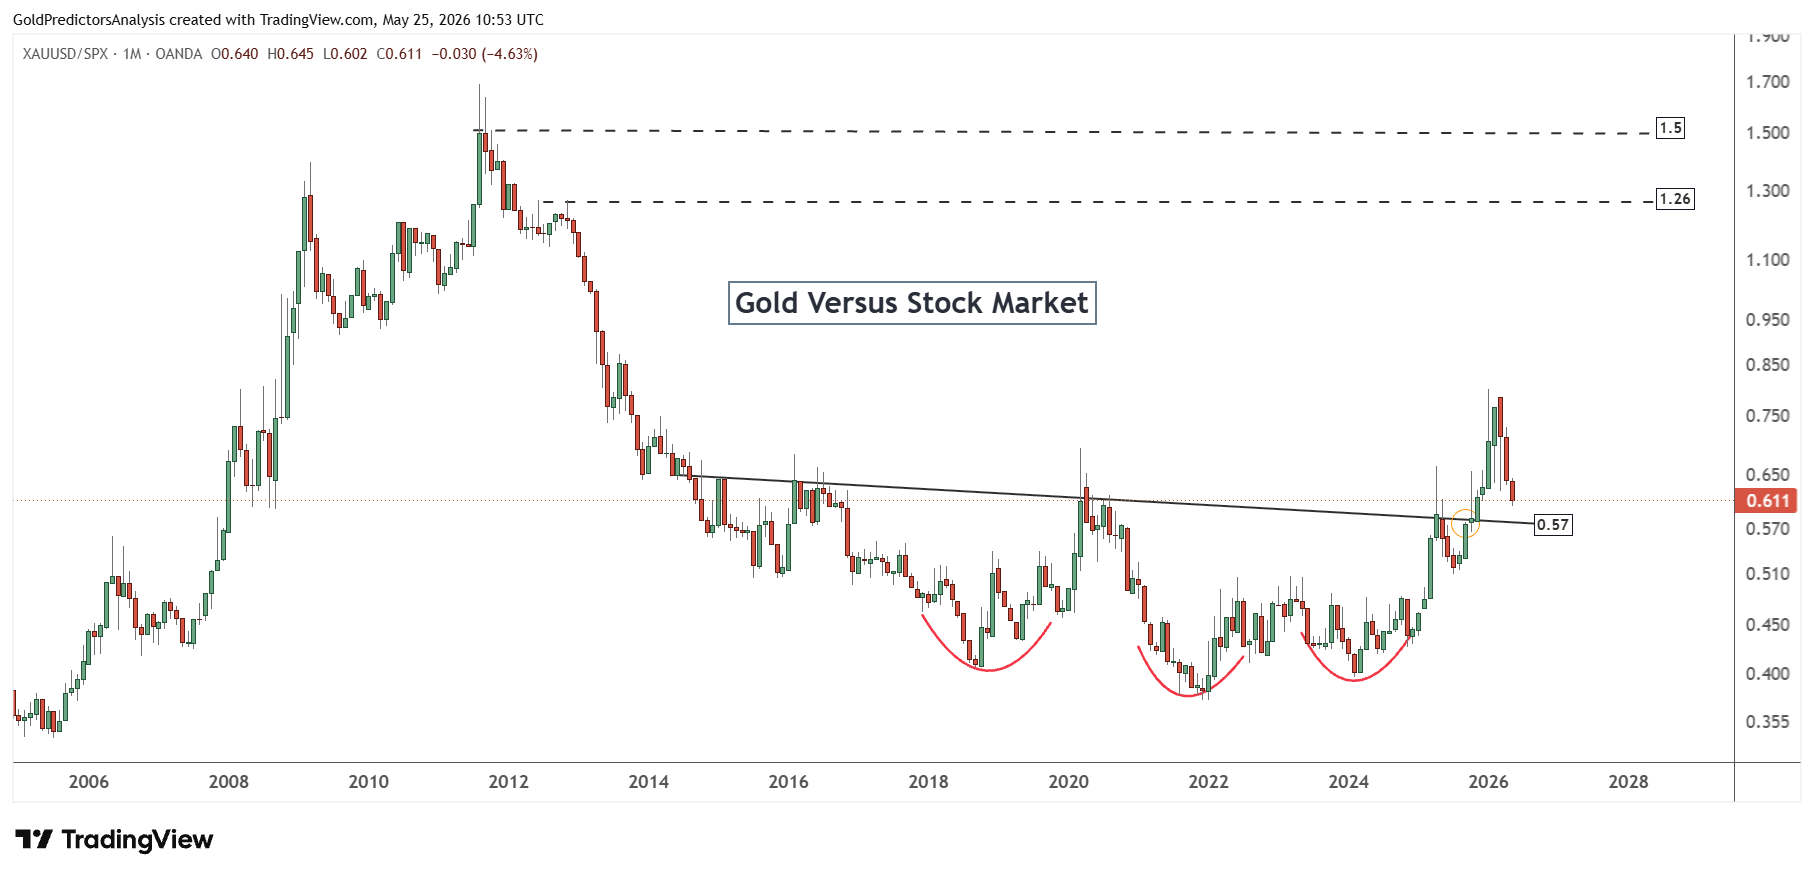
The gold-to-S&P 500 ratio has shown a strong correction in March, April, and May. The strong support remains at the 0.57 level on the monthly chart. As long as the ratio holds this support, it will likely trigger a rebound to take the ratio towards the 1.26 and 1.50 levels. Once the gold to stocks ratio starts to rebound again, then gold prices will likely confirm a bottom and continue to rally towards the record high again.
What Comes Next for Stocks and Gold
The US stock market remains in a short term uptrend. The S&P 500 has broken the 7,000 level, which suggests the likelihood of a continued rally to 8,000. The breakout in Dow Jones at 50,000 confirms the broader US stock market rally. The ease in liquidity, loose fiscal policy, AI investment and improved risk appetite are supporting equities. But this turnaround is also fraught with risk of inflation, war spending and high deficits in the background.
Gold faces short term pressure as capital keeps flowing into risk assets. But the bigger picture remains intact as gold is still a good long-term inflation hedge. The gold to S&P ratio is now very close to a key support level of 0.57. As long as that level holds, the gold can form a bottom for the next big rally.
The chart below shows that the gold price is already consolidating at the important support level of $4,500. The consolidation above this level is constructive, and a break above $5,000 is required to confirm the bottom in gold. A break below $4,360 will open the door for a drop to $4,000.
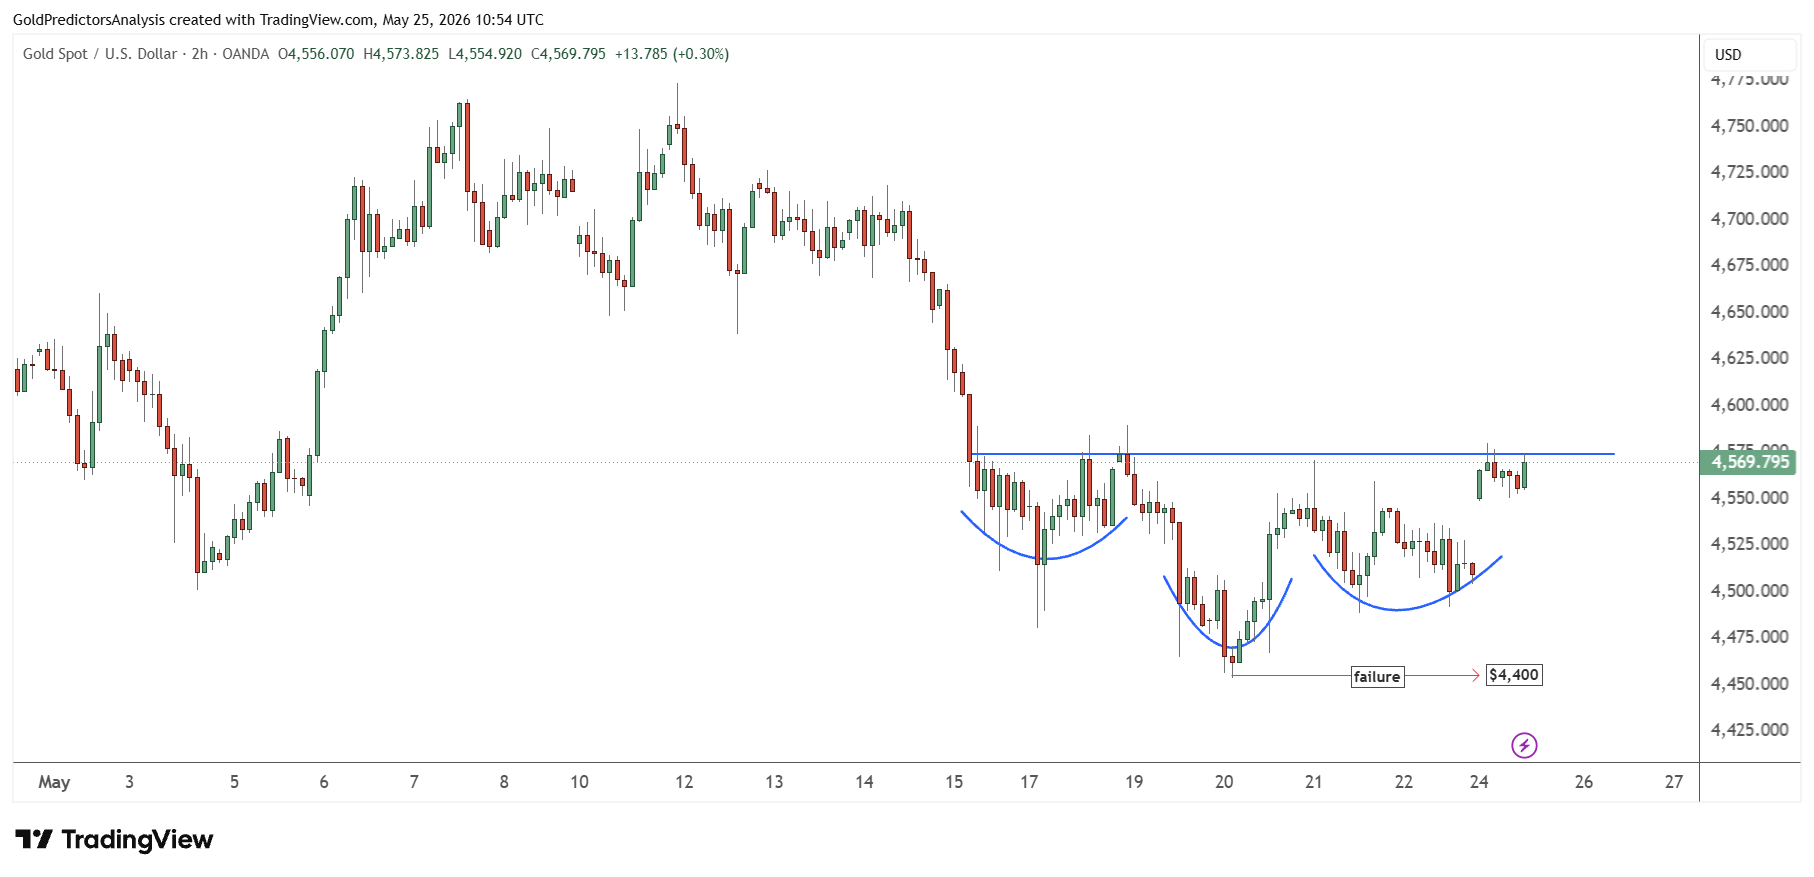
But the next move in the gold price will likely be determined by the breakout of the 50 or 200-day SMA as discussed in the previous article. Until this breakout develops, the price may consolidate between these moving averages.
Read more: Weak Dollar and Oil Drop Fuel Rebound