Gold (XAU) and silver (XAG) prices rose on Monday due to weakness in the U.S. dollar and U.S. Treasury yields. This weakness stems from the drop in oil prices due to easing tensions in the Strait of Hormuz. Spot gold price gained over 1% and reached $4,560 while the spot silver price reached $78 per ounce.
The precious metals trade with an inverse correlation to oil prices since the start of the U.S.-Iran war. The chart below shows that when the U.S.-Iran war started by the end of February 2026, oil prices surged. This surge in oil prices pushed the US dollar index and US Treasury yields higher.
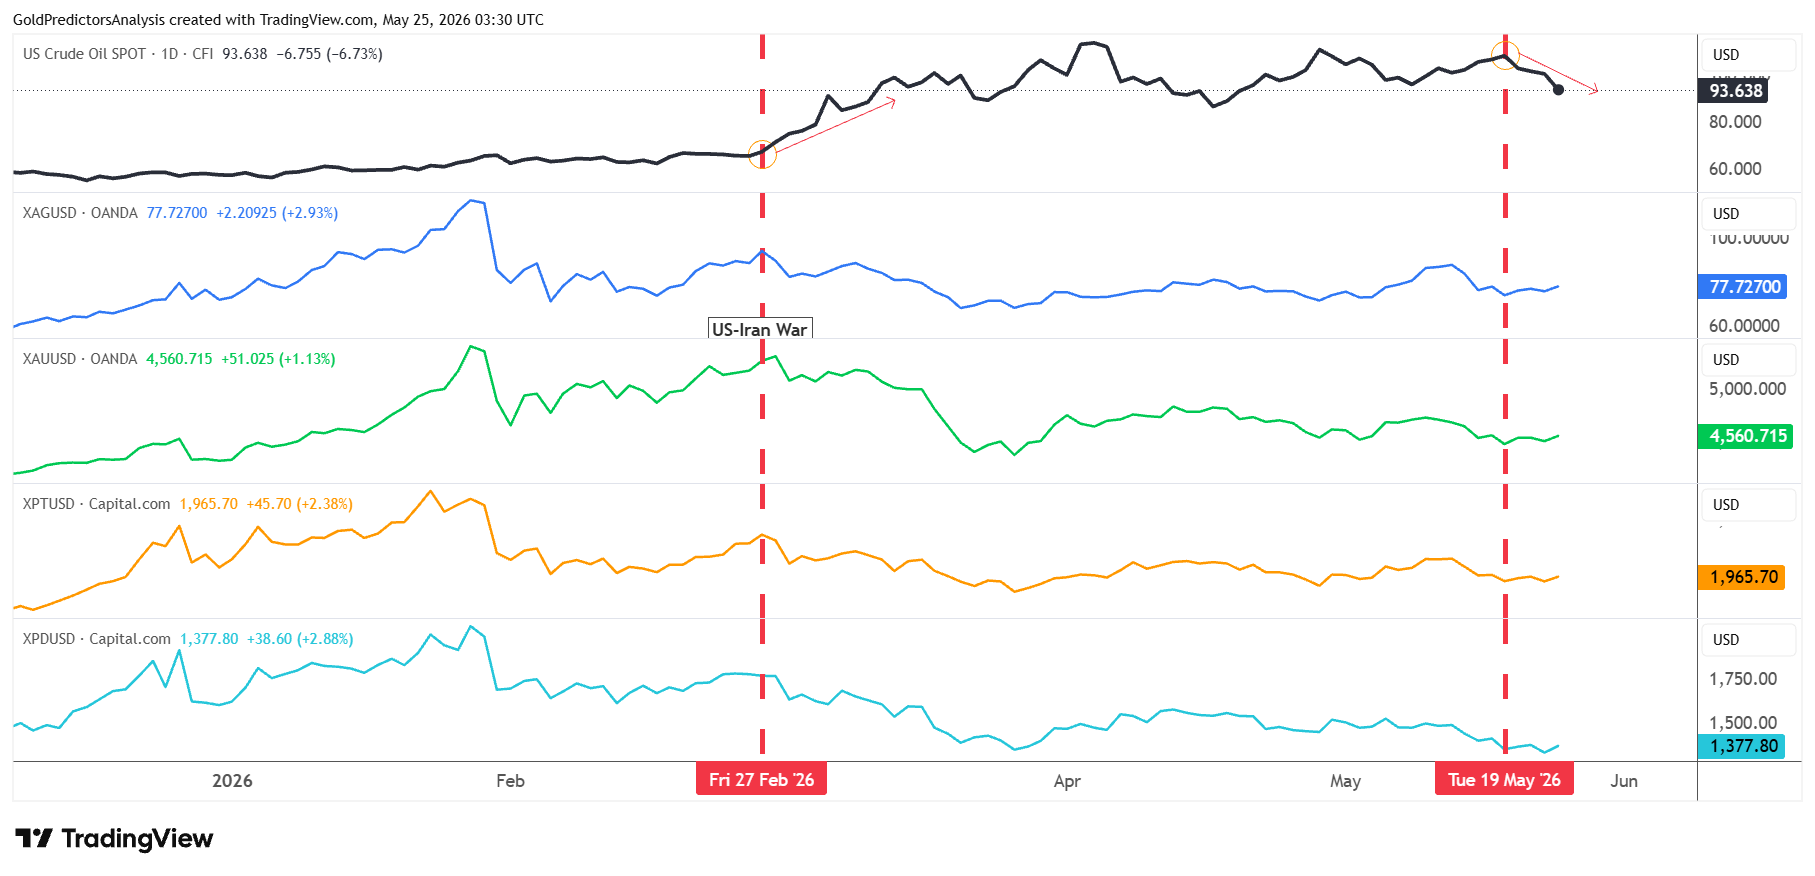
This situation kept gold, silver, platinum (XPL) and palladium (XPD) prices lower. But when oil prices failed to break above $120 and then dropped, precious metals prices rebounded from the long-term support. If oil prices continue to trade lower towards $80, then precious metals may continue to rise.
The drop in oil prices eases inflation fears and reduces the pressure on the Federal Reserve to raise interest rates. This is significant for gold as higher rates are negative for non-yielding assets. The gold price tends to see more buying when rate cut expectations rise and the US dollar weakens.

Gold Price Forecast: Rebound Depends on $4,900 Breakout
XAUUSD Holds Key Range Between $4,500 and $4,900
From a technical perspective, the spot gold price is consolidating at the edge of the ascending broadening wedge pattern above the $4,500 region. A break below $4,500 will push the price towards the 200-day SMA at around $4,380. However, a break below $4,380 will likely take the price towards $4,000.
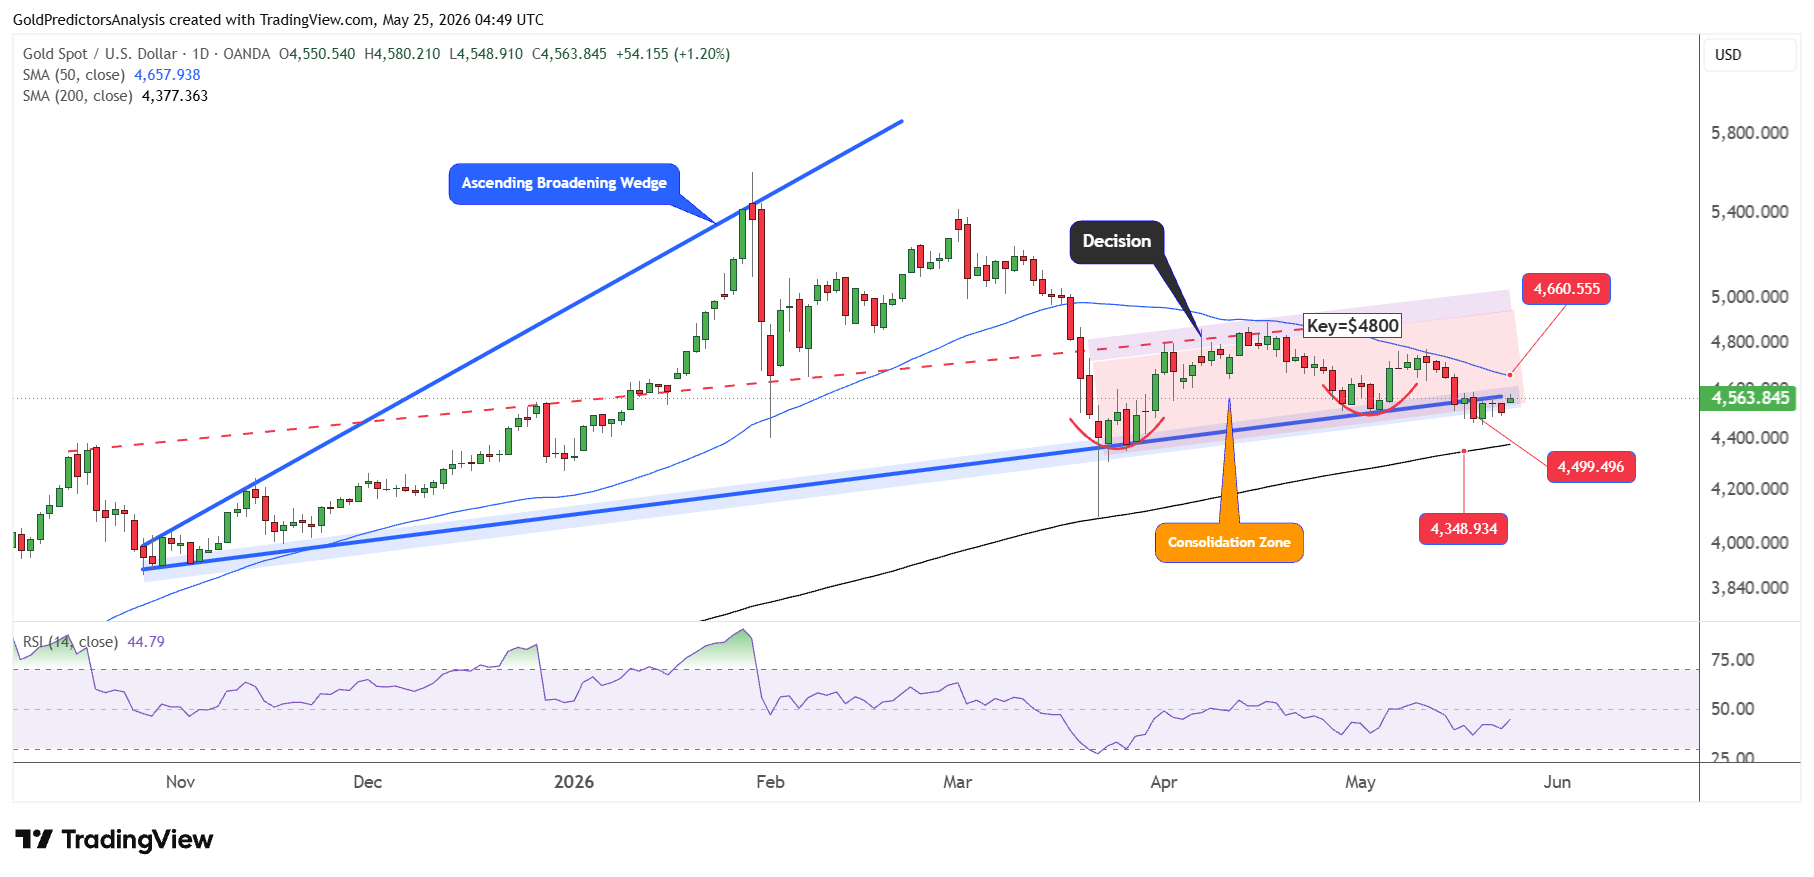
On the other hand, the immediate resistance in spot gold remains the 50-day SMA at around $4,660. A break above this SMA will likely push prices towards the key region of $4,800 to $4,900.
A break above $4,900 is required to sustain the bullish momentum in the gold market. Overall, the price is consolidating between $4,500 and $4,900 and requires a clear break of this zone to find the next move.
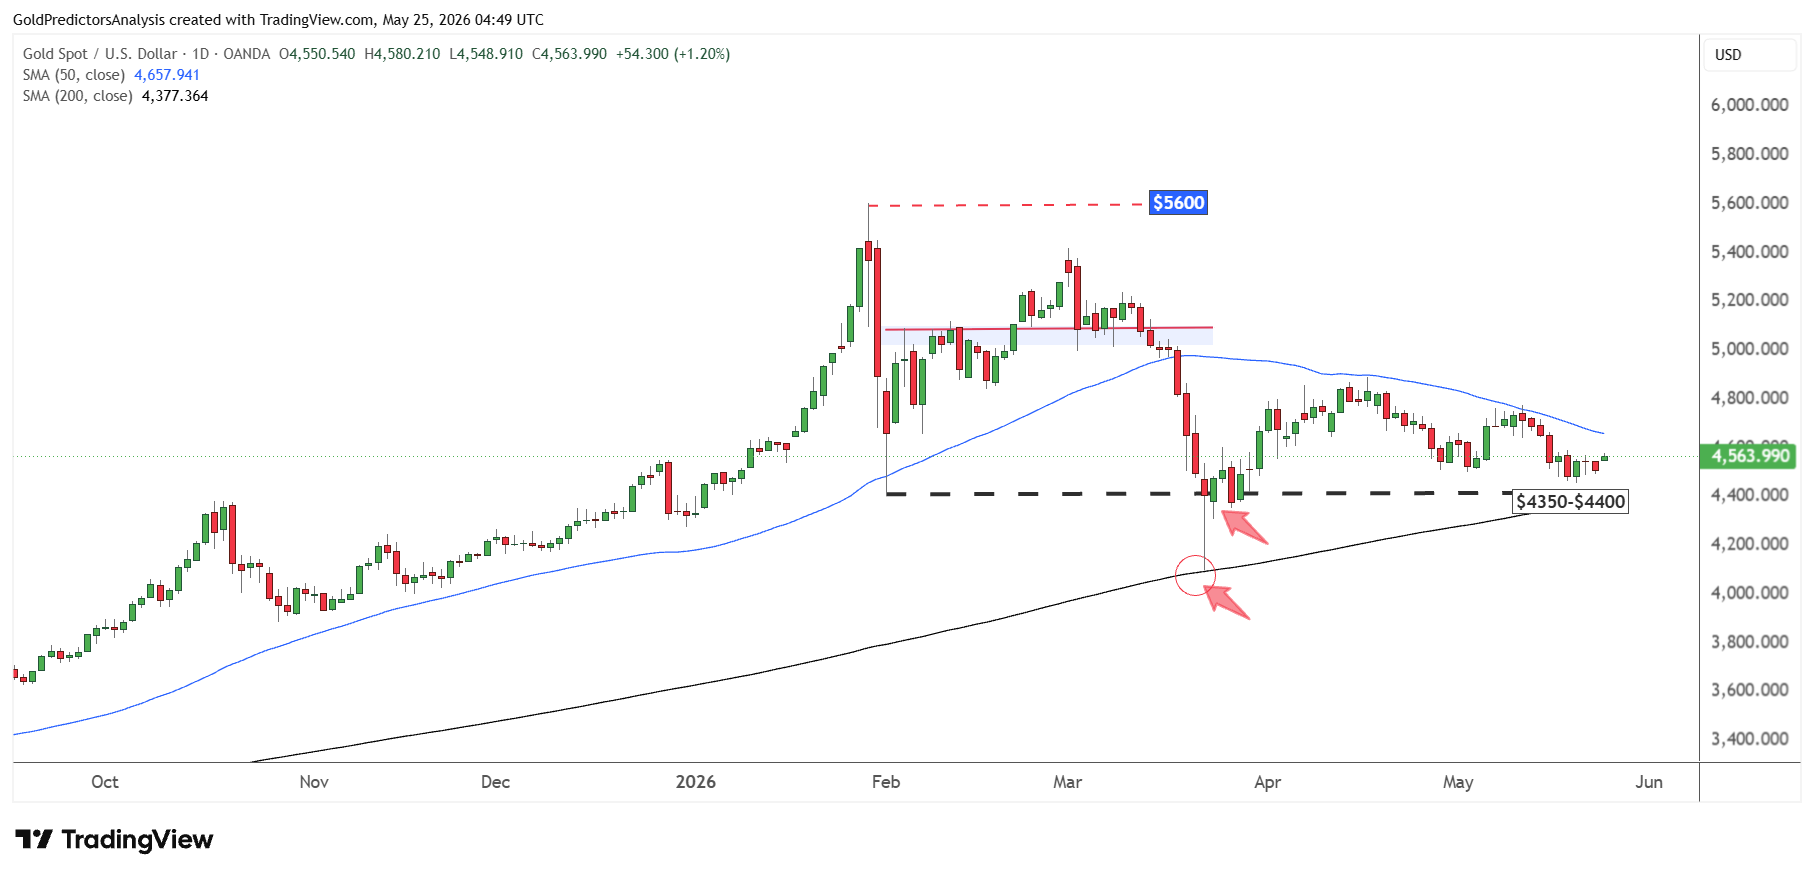
The importance of the current range is also evident on the daily chart below, which shows that the price is compressing between the 50-day and 200-day SMAs and requires a breakout of this range to determine the next move.
Gold Price Forecast
Every new Gold analysis as it publishes, today's technical signal and key levels, live price — on one page.
See all Gold forecastsShort-Term Gold Outlook Remains Uncertain Below $4,678
The short-term price structure for spot gold remains uncertain, as the price consolidates within the yellow zone and needs a break. The immediate resistance for spot gold in the short term is $4,678 at the blue trend line. A break above this level will likely push spot gold towards $4,860.
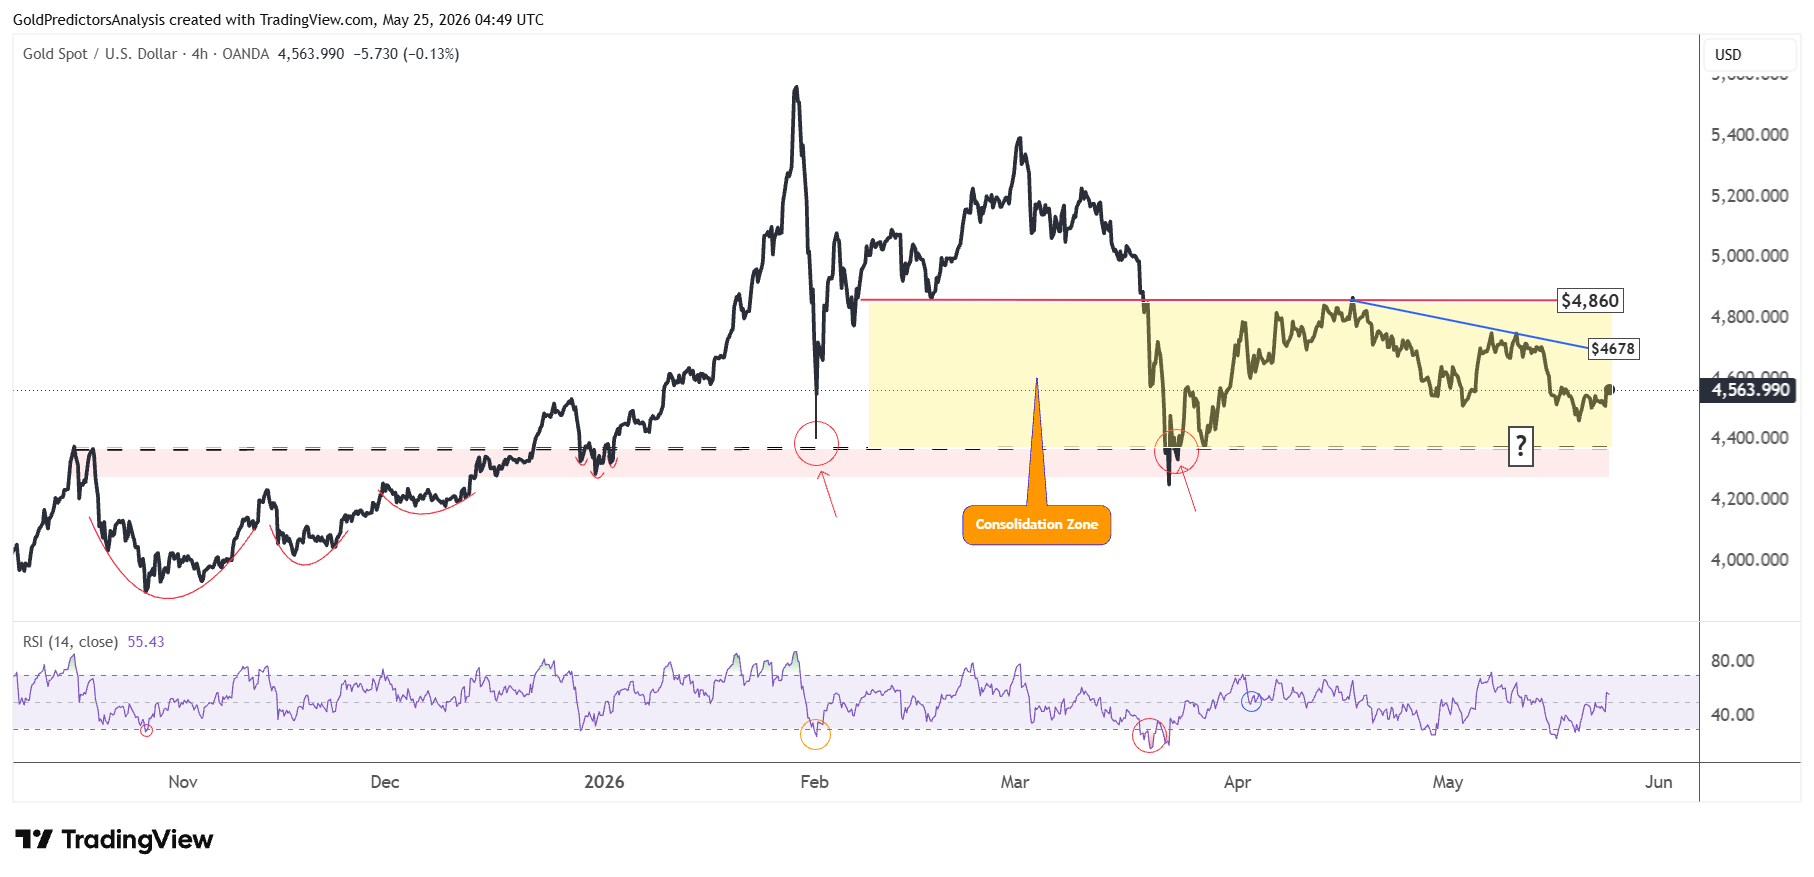
But a break below $4,500 will push the price towards the red region between $4,400 and $4,500. The RSI is also rebounding from oversold on the 4-hour chart, which keeps uncertainty in the short term.
Silver Price Forecast: $72 Support Holds as $89 Resistance Caps Upside
XAGUSD Needs a Break Above $89 to Restore Bullish Momentum
A similar consolidation is also seen in the silver market as the price failed to break above $89 on 13 May 2026. But spot silver also failed to break below $72 last week and rebounded higher. But this rebound is still weak and shows uncertainty in the short term.
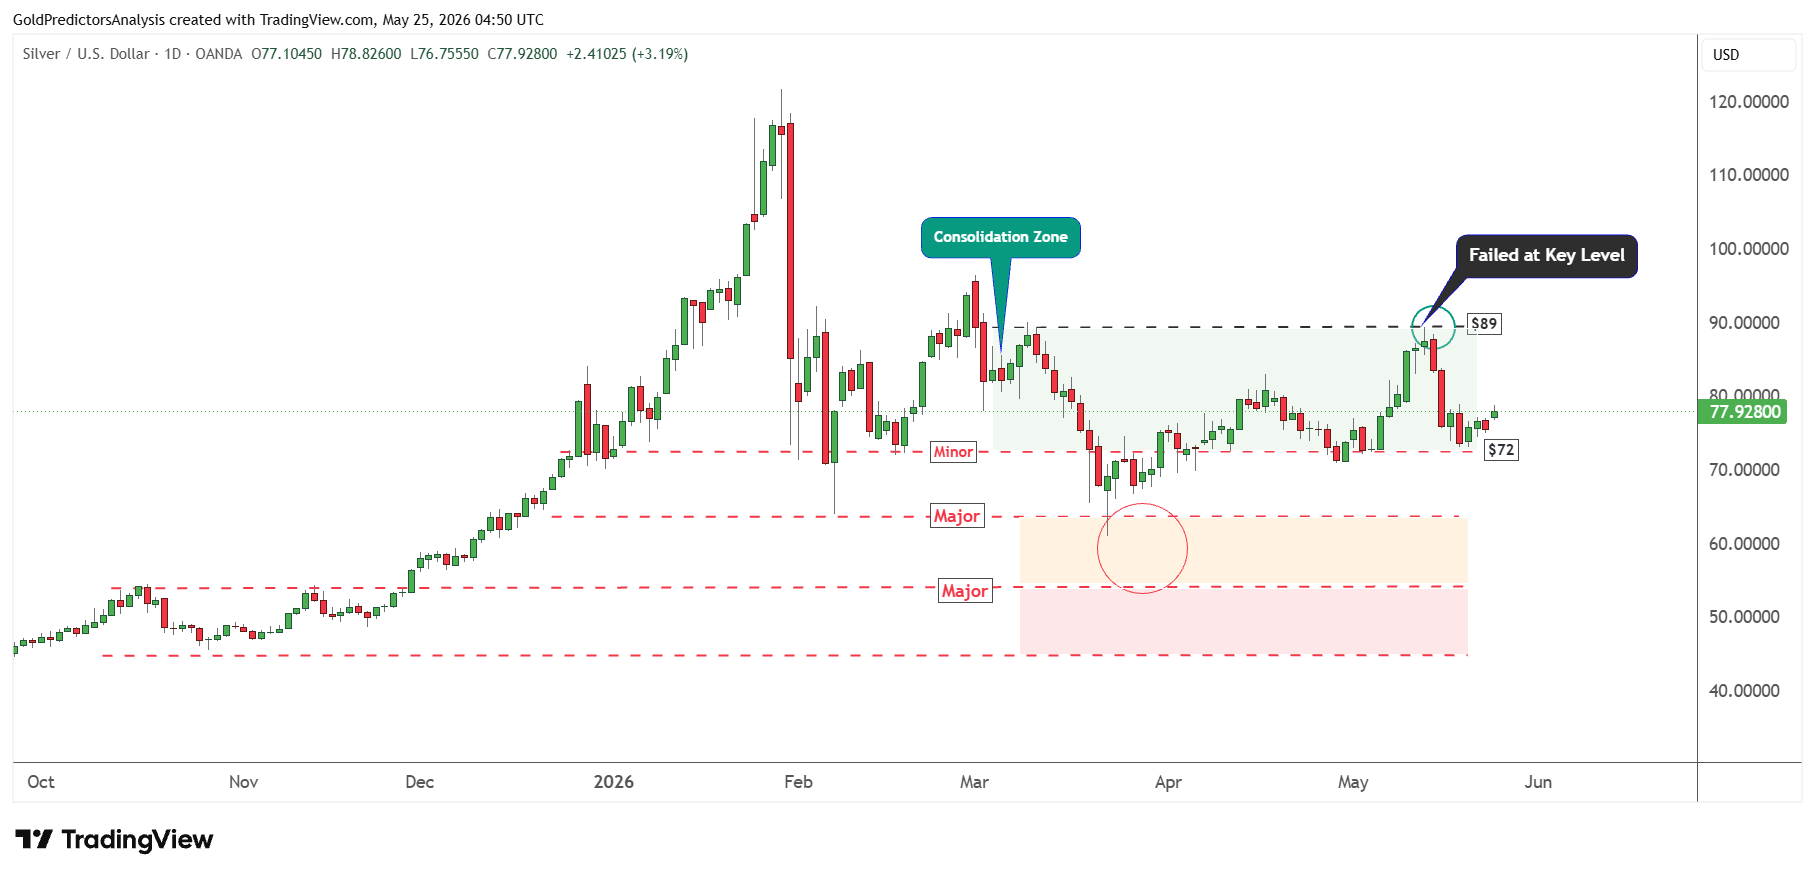
The big gap on Monday in the silver market was due to lower oil prices and news from the Middle East, which created market uncertainty. The ongoing Middle East crisis has kept the spot silver in the $70 and $89 region, where a breakout of either level is required to take prices to the next level.
Silver Price Support: Why the $72 Level Matters
The importance of the $72 area is also evident in the daily chart below. The chart shows that the price is rebounding from the support within the ascending broadening wedge pattern. Despite this constructive rebound from $72, the RSI remains below the mid level on the daily chart. This keeps uncertainty in silver prices.
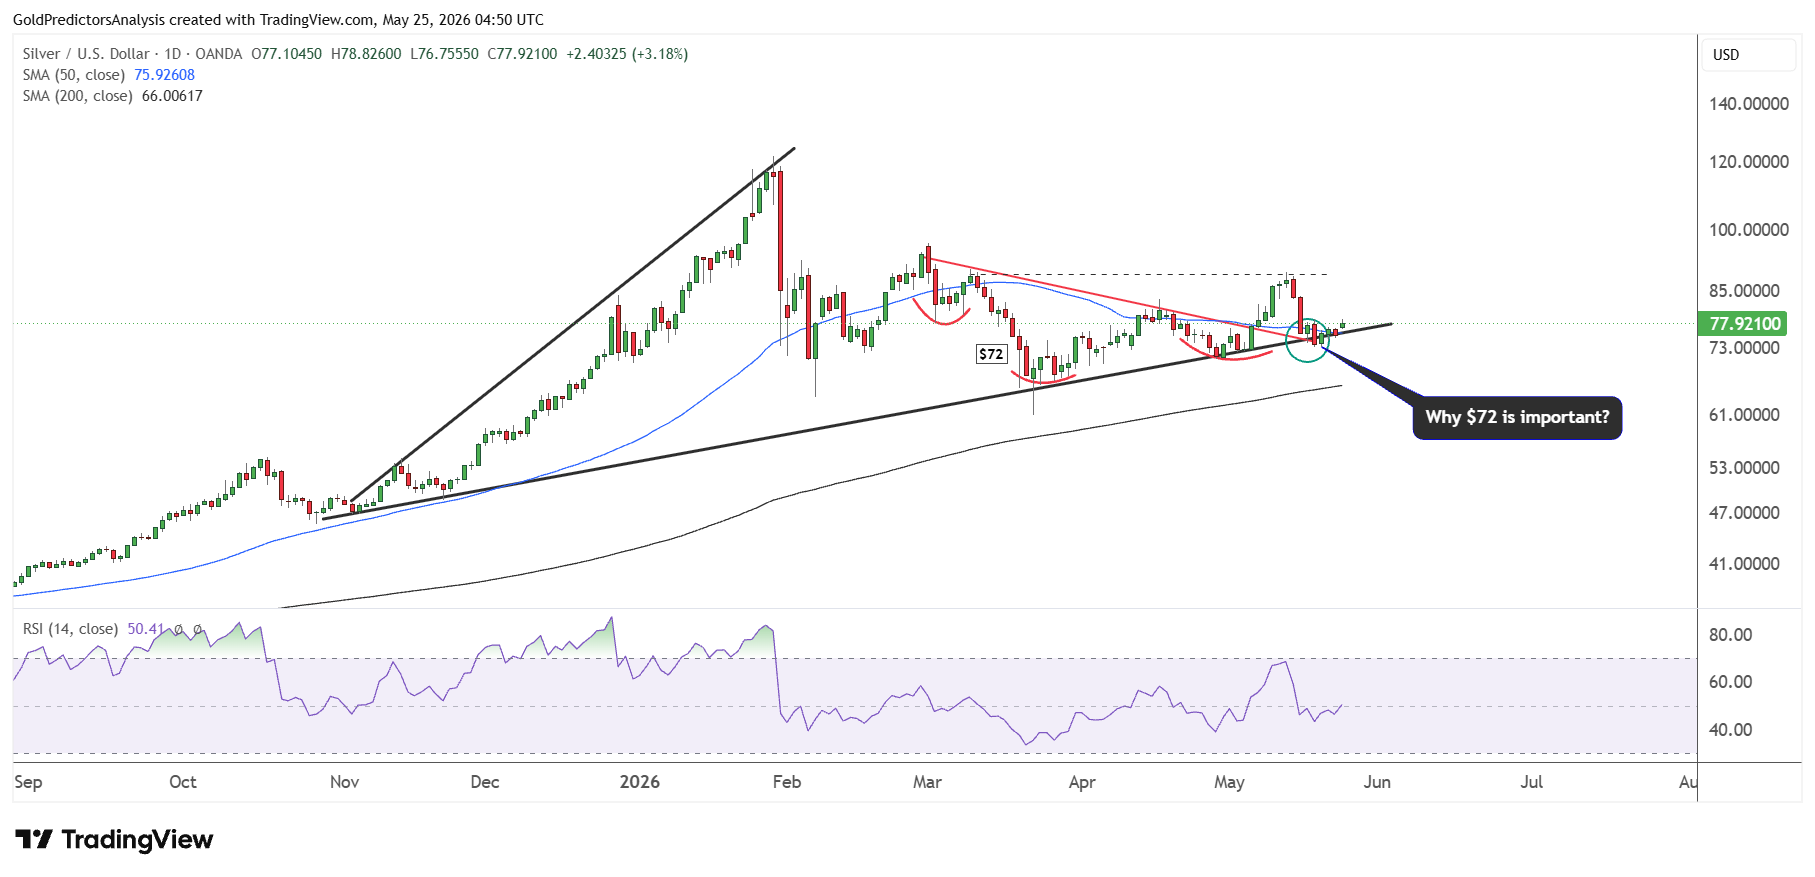
Overall, a break above $89 in silver is required to keep the bullish momentum. But a break below $70 will likely destroy the bullish structure and take prices lower towards the next buy zone of $50-$60.
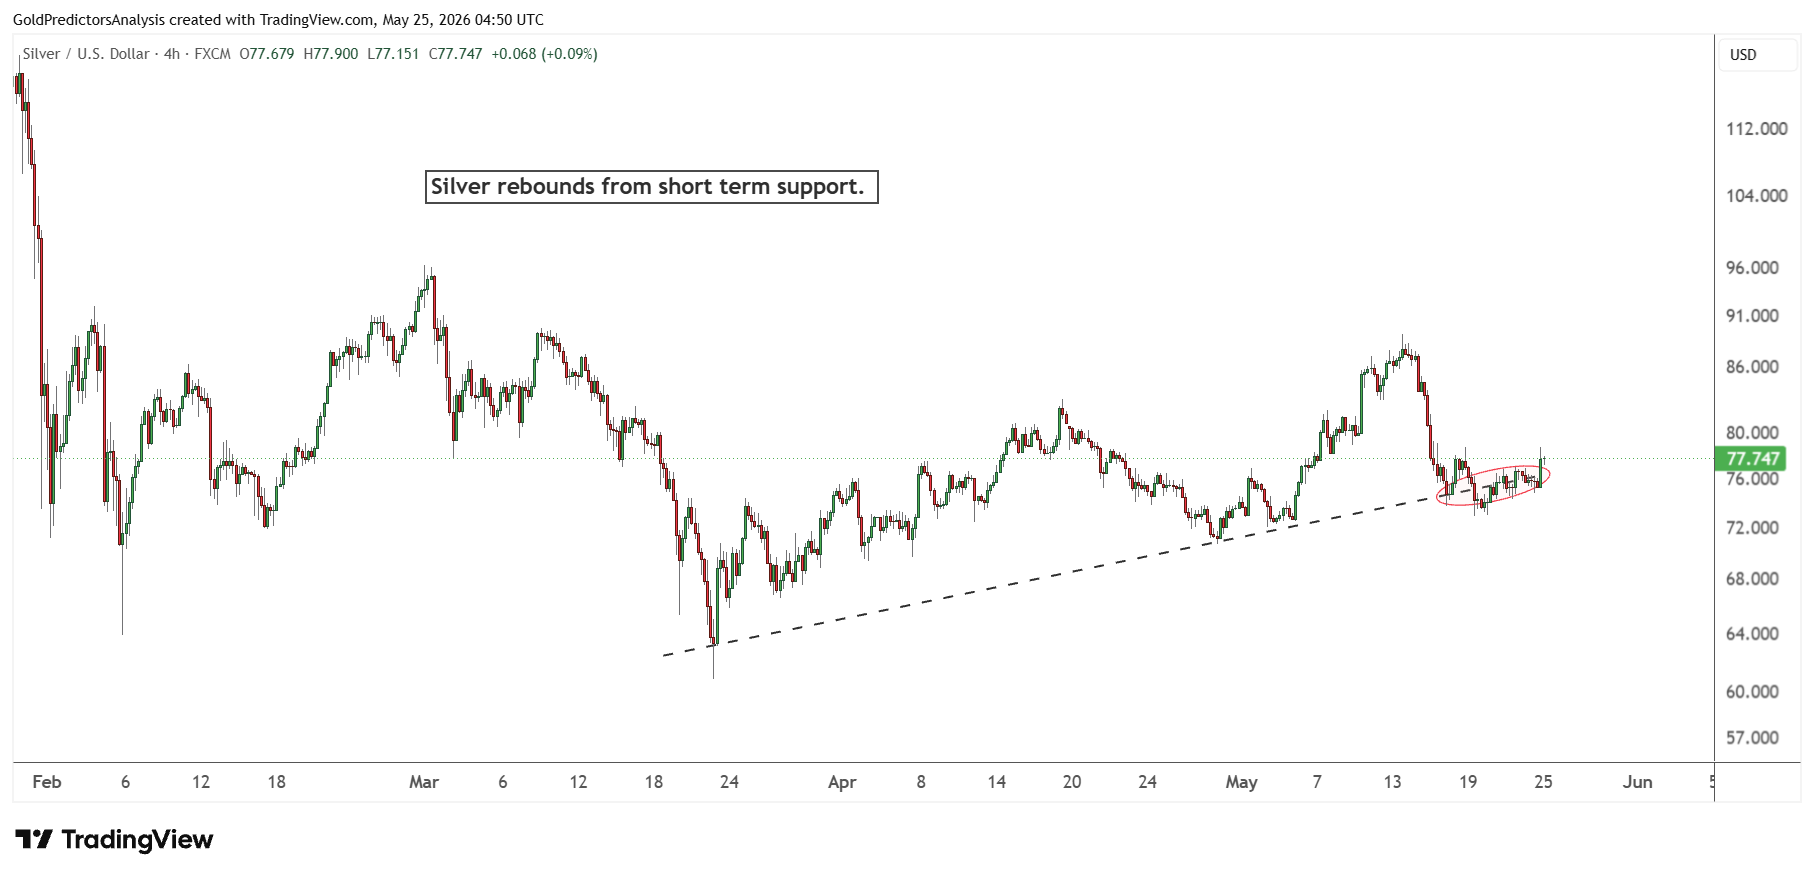
The short-term spot silver price rebounded from the black dotted trend line, as discussed in the previous article. This rebound still maintains the bullish view. But a failure to hold $72 will lead to a drop in the short term.
What Is Next for Gold and Silver Prices?
Gold and silver are now looking for a decisive move out of their key ranges. Gold needs a break above $4,900 to establish further bullish momentum, while a move below $4,500 could bring the price back down under $4,380 and $4,000. Silver is also hovering around $70- $89 range and needs to move above $89 to begin the bullish momentum. In the short run, falling oil prices, weak Treasury yields and a weak U.S. dollar are expected to benefit precious metals. But gold and silver require confirmation from charts before the next big move.
Read more: Can XAUUSD Defend $4,400 as Treasury Yields Rise?