



July WTI crude oil futures fell more than 2% Friday and are testing $87.91 support late in the session. Spot Brent crude oil dropped more than 2% to trade near $91.61. Seven straight days of selling since the $105.21 high on May 18. President Donald Trump is in the White House Situation Room right now meeting with advisors on the 60-day ceasefire framework with Iran. The Strait of Hormuz could reopen within weeks. The charts and the fundamentals are pointing the same direction. Here is the setup.
Is the Ceasefire About to Flood the Market?
The 60-day ceasefire framework between the United States and Iran went from rumor to near-certainty in 48 hours. Government officials on both sides are working toward a plan that reopens the Strait of Hormuz and restores commercial shipping. Twenty percent of the world’s oil supply normally moves through that waterway. It has been shut since the fighting started earlier this year. Brent traded as high as $138 a barrel on the disruption. Friday it is sitting near $91. That is a $47 collapse built entirely on the expectation that the oil starts flowing again.
Trump is in the Situation Room. Administration officials say several major issues remain, including security commitments and regional stability terms. But both sides are negotiating. They are not shooting. The market does not need a signed deal to sell. It needs the trajectory to stay pointed toward a deal and right now it is.
Did High Prices Already Kill Demand?
The selloff is not just about the ceasefire. The damage from $138 Brent is already showing up in the consumption data. Japan, South Korea, and India all faced surging fuel costs when Middle Eastern exports got disrupted. Consumers and businesses cut usage wherever they could. The International Energy Agency said it directly in recent reports. Consumption came in weaker than expected and that helped balance some of the supply fears that dominated the first half of the year.
The U.S. Energy Information Administration updated its outlook to reflect improved oil flows from the Middle East. OPEC members are still holding spare production capacity they can bring online. The supply side is loosening at the same time the demand side is weakening. That combination is why the dip buyers who showed up at every support level on the way up are not showing up now.
Brent Oil Price Forecast
Every new Brent Oil analysis as it publishes, today's technical signal and key levels, live price — on one page.
See all Brent Oil forecastsWhy Did Inventory Data Not Matter?
U.S. government figures this week showed crude oil, gasoline, and distillate fuel inventories all declined. Refineries increased activity to meet rising seasonal demand. Lower inventories normally support prices. Not this time. The market looked at falling stockpiles and shrugged because the ceasefire headline is a bigger story. Millions of barrels potentially coming back through the Strait of Hormuz dwarfs one week of domestic draws. Traders are not trading last week’s inventory data. They are trading next month’s supply picture and that picture has a lot more oil in it.
Daily July WTI Crude Oil Technical Analysis
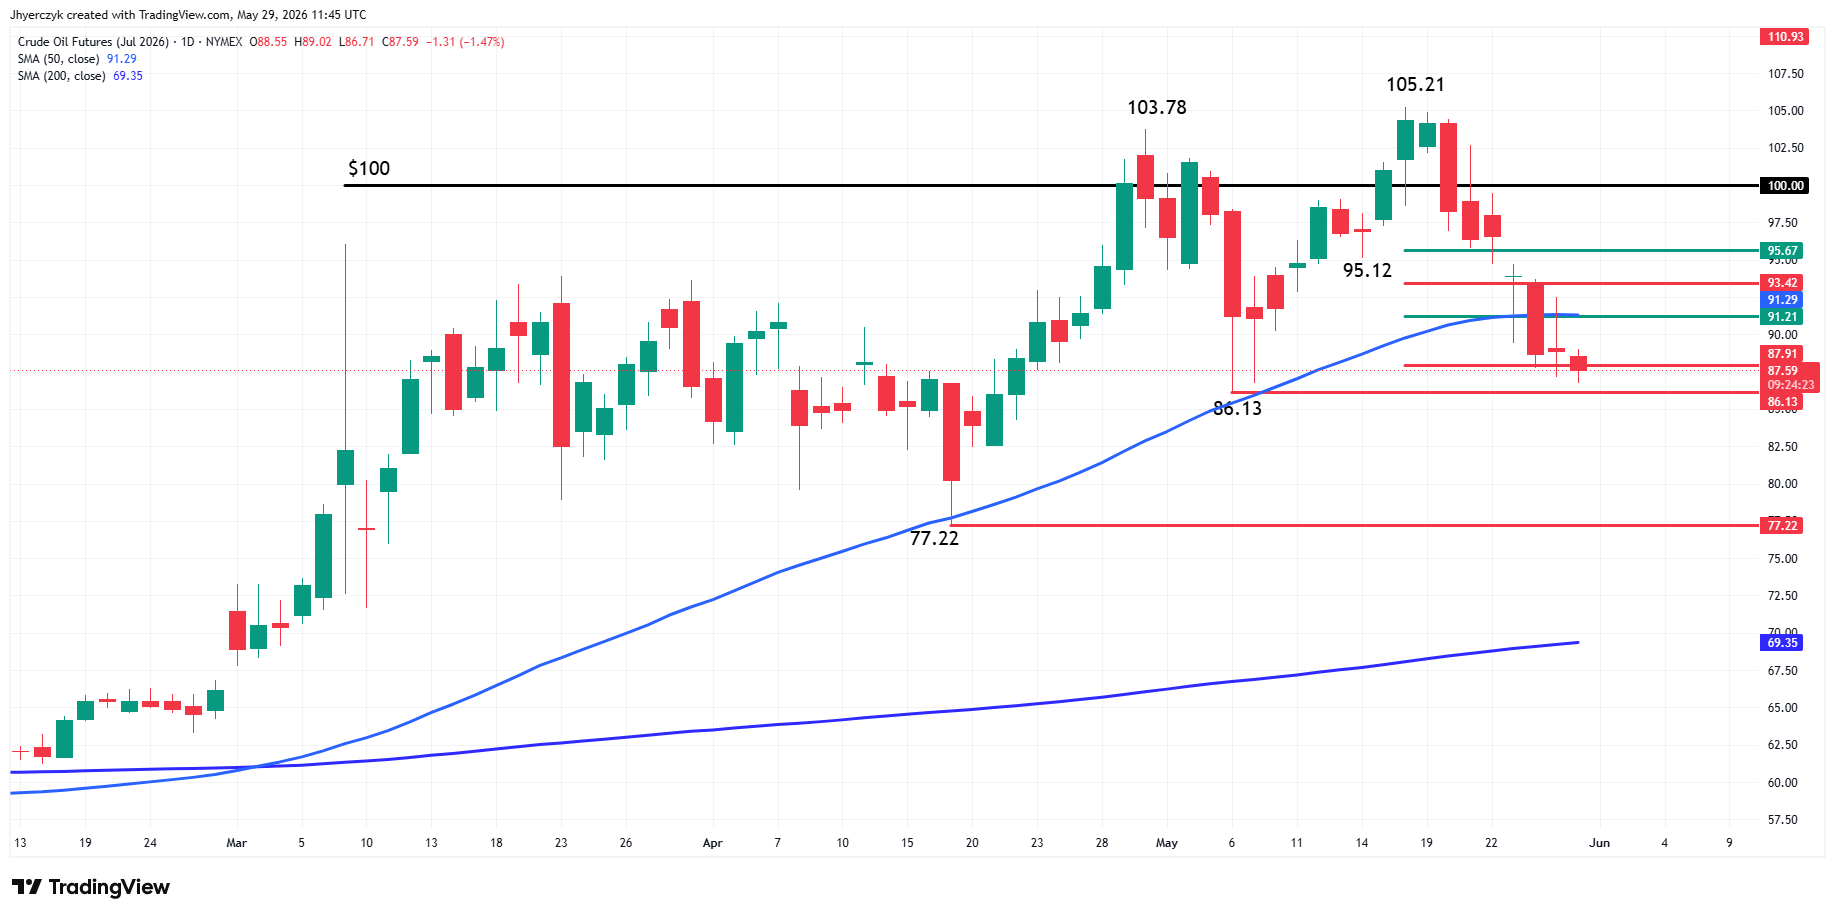
July WTI crude oil futures are lower late in the session on Friday. Earlier in the session, the market took out yesterday’s low to extend the weakness for a seventh day.
Despite the hard break from $105.21 on May 18, the main trend is still up. However, momentum has clearly shifted to the downside.
A trade through $86.13 will change the main trend to down. Longer-term traders may be viewing $77.22 for the change in trend. As long as these bottoms remain intact, we’re going to have some faction of the market looking to buy the dip.
Currently, the market is straddling the lower end of a minor retracement zone at $87.91. The most important retracement zone support is $80.24 to $74.35. I think it is major support because it surrounds the swing bottom at $77.22. This makes it our value zone.
If you’re following the moving averages then you know that the outlook shifted earlier this week when the market crossed to the weak side of the 50-day moving average at $91.28. This price is not only potential weakness, but also the trigger point for an acceleration to the upside. On the downside, the 200-day MA at $69.35 is providing support while gradually guiding the market higher.
Over the short-run, trader reaction to the 50-day MA should set the tone.
Daily Spot Brent Crude Oil Technical Analysis
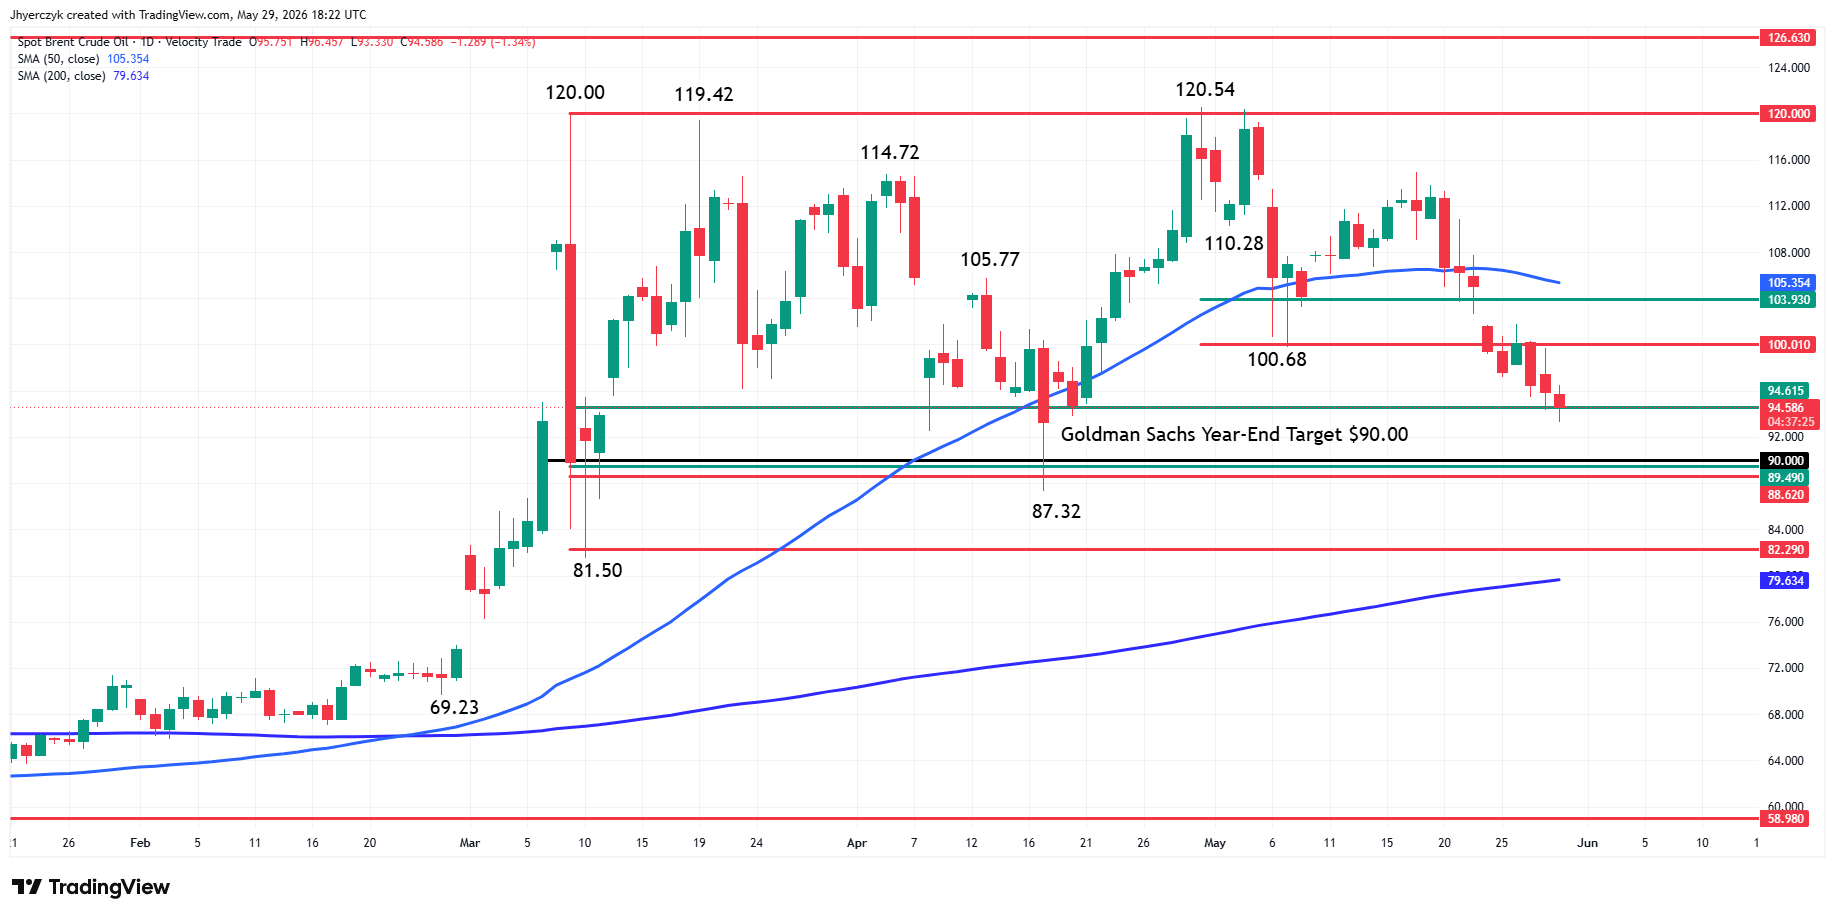
Spot Brent crude oil is trading lower late Friday, but testing the first major support zone at $94.61 to $88.62. The second major support zone is $89.49 to $82.29. If you combine these two areas, you’ll find that the strongest point is likely a support cluster at $89.49 to $88.62. This is our value area. New buyers could show up on a test of this area with $87.32 a strong lean or exit point.
The market is trading well below the 50-day moving average at $105.35. This is our major resistance. Additional resistance is retracement levels at $100.01 to $103.93.
We’re likely coming into the volatile area on the charts where buyers step in because of value, and sellers counter because of the shift in momentum. Furthermore, I think we’re still a headline driven market.
What Happens When the Strait Reopens?
The ceasefire and the demand destruction are working the same side of this trade. Barrels come back through the Strait of Hormuz. They land in a market where $138 Brent already crushed consumption across Asia. Japan, South Korea, and India all cut usage and that demand is not coming back overnight. OPEC is still sitting on spare capacity it has not touched. More supply arriving into weaker demand. The entire bull case from the first half of the year was built on disruption. That story is ending and nothing has replaced it.
The 50-day moving average at $91.28 on July WTI crude oil is now resistance. Below it the sell-the-rally trade stays alive with $86.13 as the trigger for a trend change and $77.22 as the next major target inside the value zone at $80.24 to $74.35.
On Spot Brent crude oil the support cluster at $89.49 to $88.62 is where value buyers show up first. A break through $87.32 says they failed. The ceasefire decides the timing. The demand data decides the floor.
If you’d like to know more about how to trade crude oil, please visit our educational area.