


The US dollar index has broken the key level of 100.50 while the US Treasury yields continue to climb within the bullish trend. This upside breakout in the US dollar and bullish patterns in the US Treasury yields continue to pressure the platinum (XPL) prices in the short term. In my view, this correction is pushing the metals into the next buy zones where the strong rally may develop. This article presents the key macro drivers, technical levels for platinum prices, ratio signals and the long-term support zones that could shape the next major move in platinum prices.
US Dollar Breakout Pressures Platinum Prices
The strength of the US dollar index is negatively affecting platinum prices. The US dollar index has already surged higher and is still at the top of the year range. This helps reduce the demand for precious metals as the traders switch to the dollar when the U.S. rates look stronger.
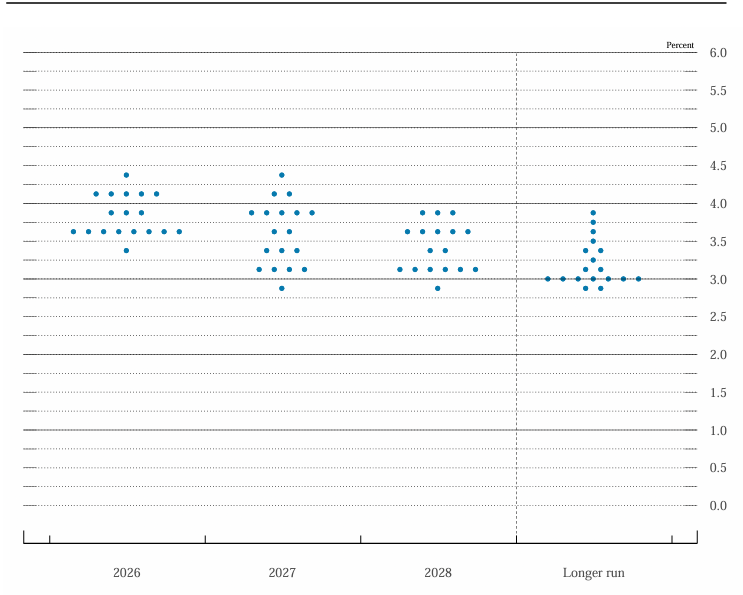
This strength is largely because of the hawkish Fed. The markets are expecting that the Fed will maintain a tight policy and may even increase rates further this year. The dot plot also shows an increasing number of officials expecting a rate hike this year.
From a technical perspective, the US Dollar Index broke the key level of 100.50 last week and closed at 100.76. This strong weekly close indicates a breakout from the long term consolidation since last year.
This breakout followed strong bottom patterns from April 2025 to June 2026. This bullish formation indicates that the US dollar is poised to move to 103 in the near term.
But a break above the 103 level will likely push the US Dollar Index toward the 106-107 zone. This zone is the resistance of the descending trendline coming from the October 2022 highs.
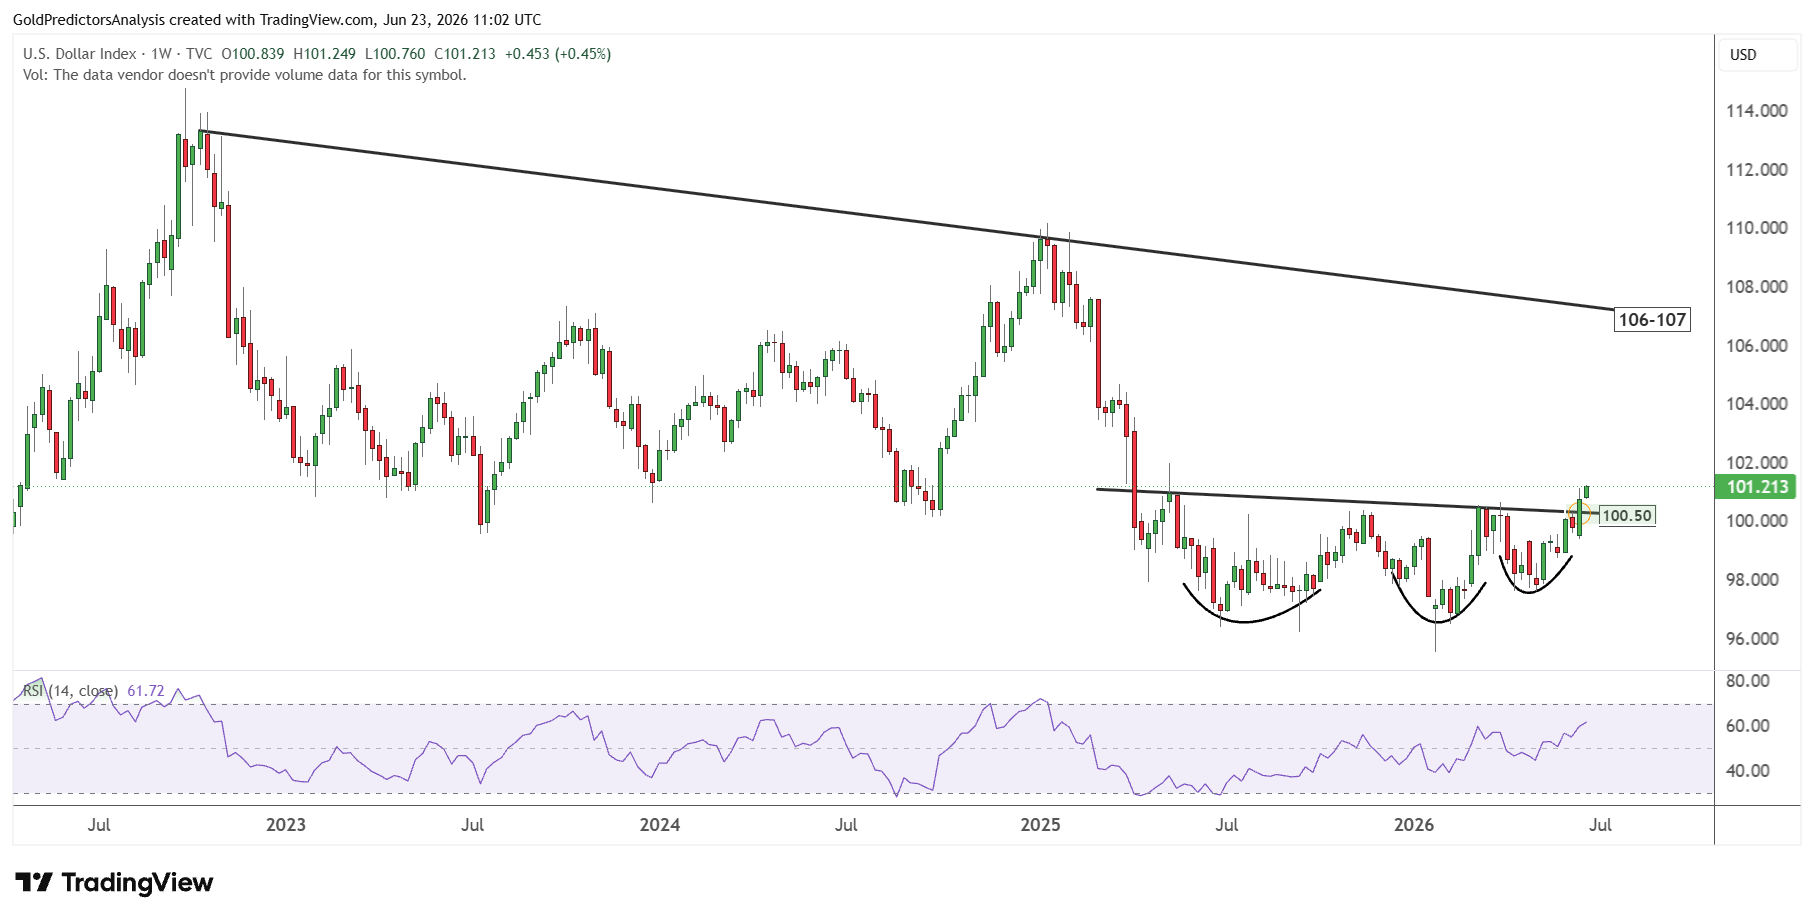
This bullish price action in the US Dollar Index suggests that precious metal prices may remain under pressure in the short term and wait for the index to form a peak.
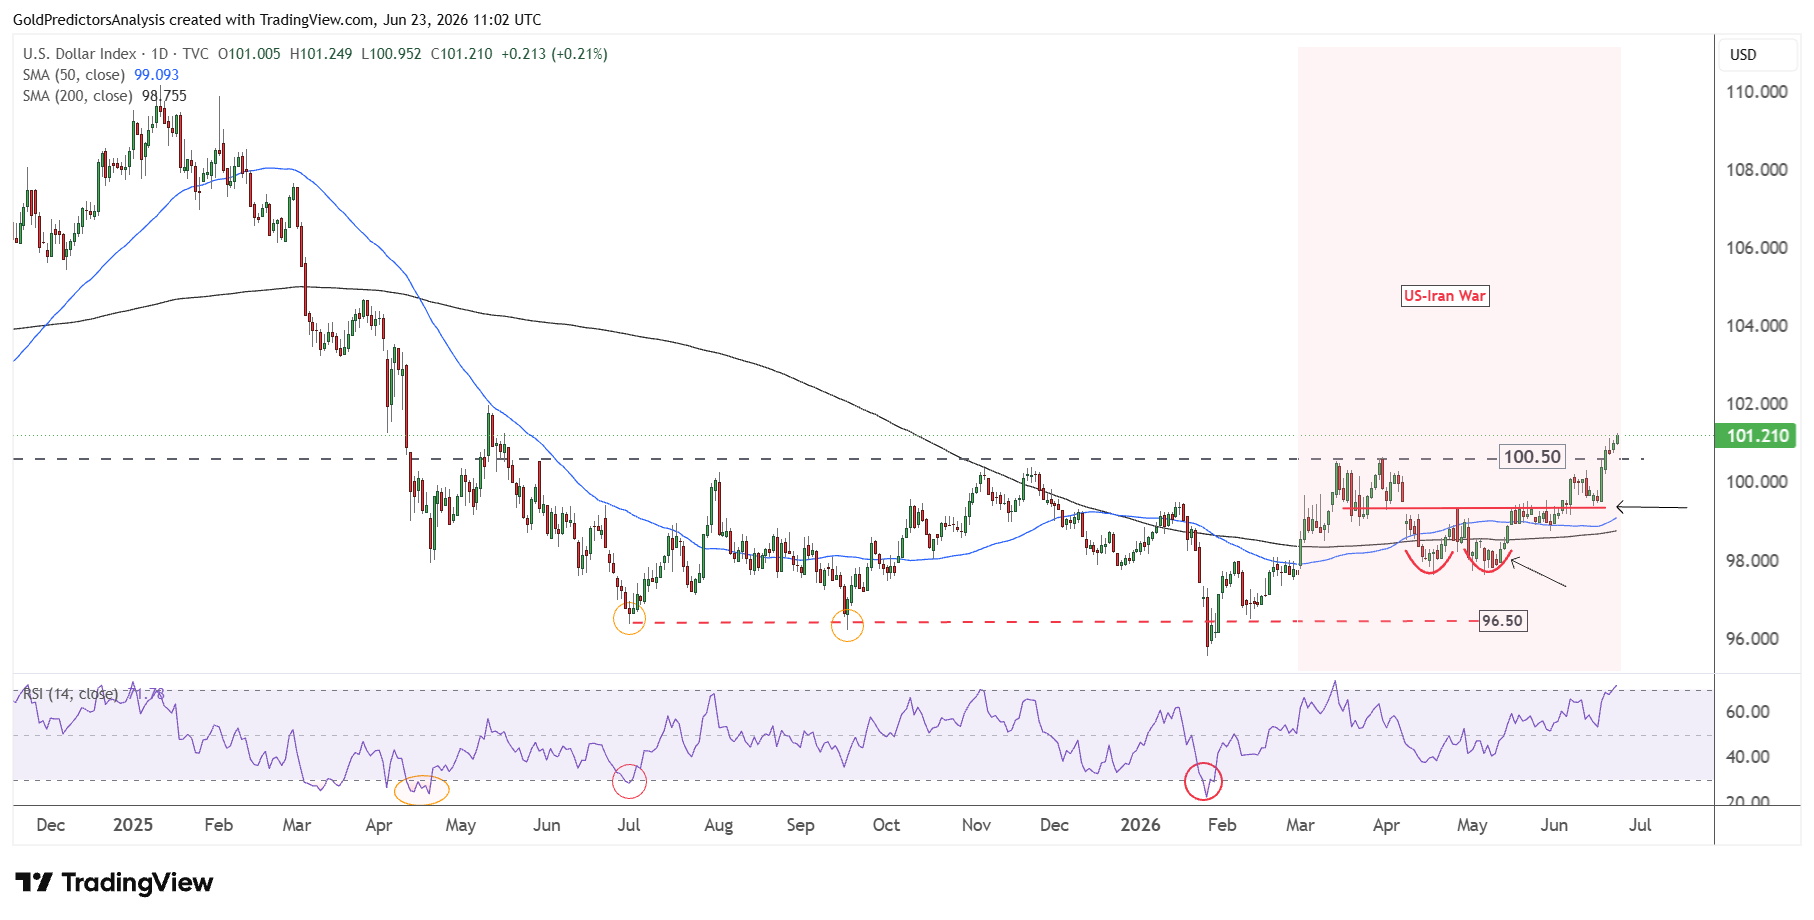
This price action developed by forming a double bottom pattern in April and May 2026 as seen in the chart below. The breakout at the neckline of this double bottom at 99.40 triggered a strong move toward the 101 level.
The formation of strong consolidation over the past year and then the breakout after forming the bullish price action suggest that the US dollar may remain higher in the short term.
Treasury Yields Add More Pressure to Precious Metals
The strength in the U.S. Treasury yields also adds pressure to the platinum prices. The 2-year yield has reached the highest level since early 2025. This indicates that the traders are pricing in a tighter Fed path. This impacts the whole precious metals market. Gold (XAU) and silver (XAG) are already under pressure, and platinum is following the same pressure as the market cuts its exposure to non-yielding products.
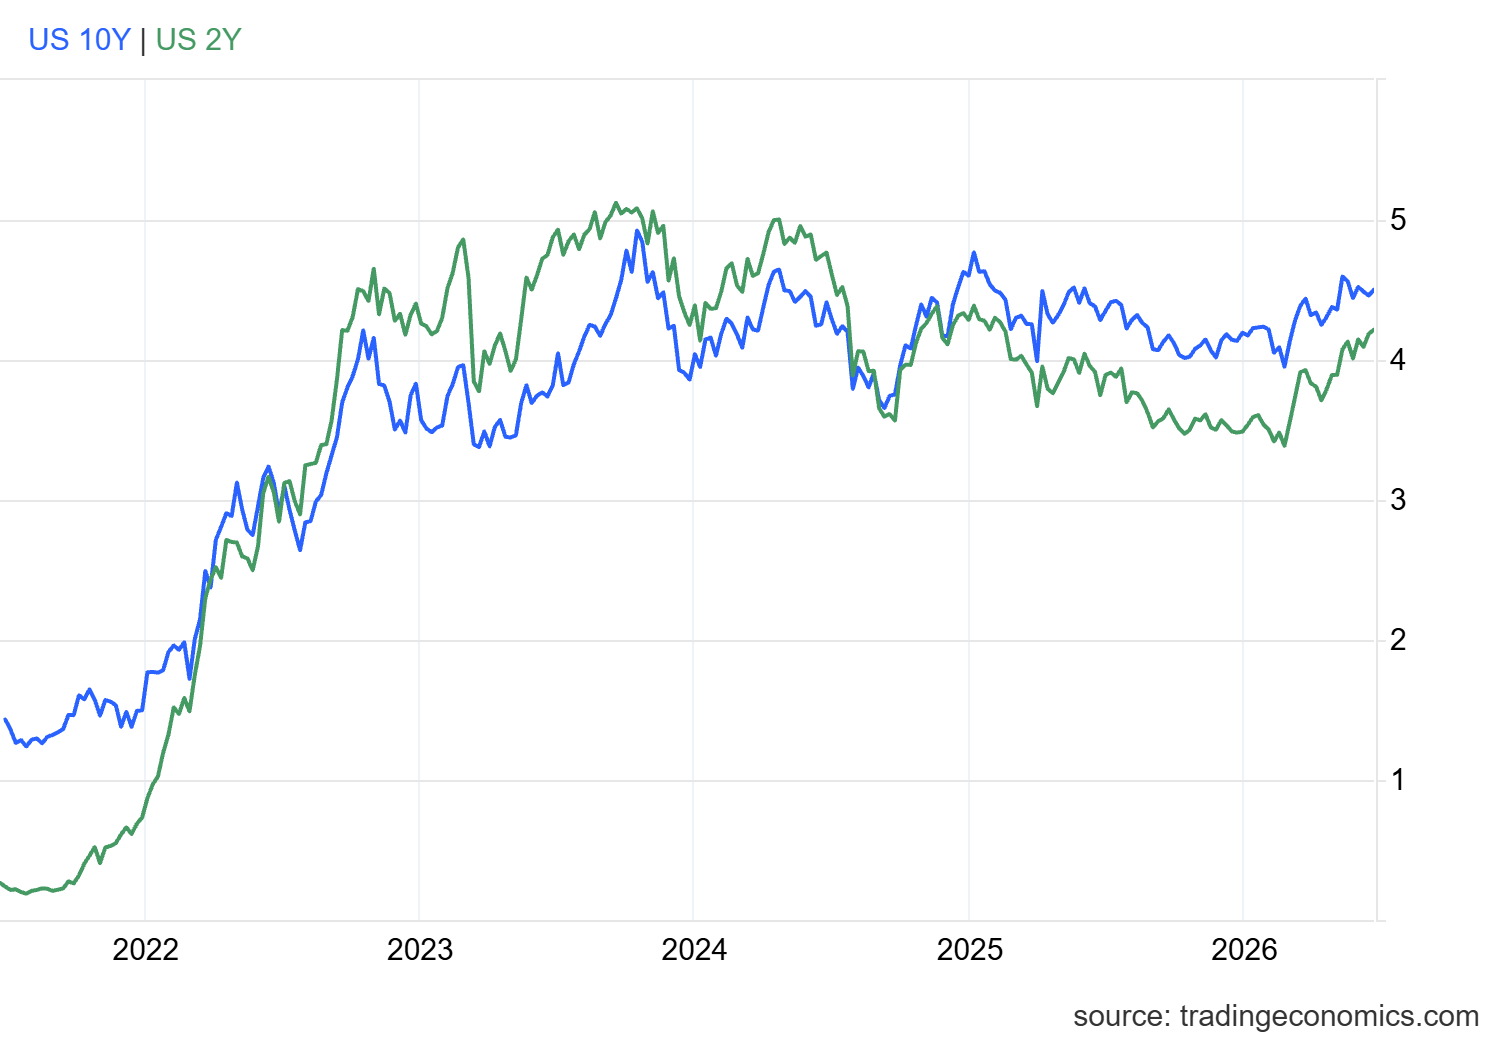
The short term catalyst is still bearish for platinum as the dollar and Treasuries are going higher. A correction in US dollar and US Treasury yields is required to confirm the next rally in precious metals.
This strength is further confirmed by the 10-year US Treasury yield. US Treasury yields found support at 4.45% at the 50-day SMA. This support indicates that the US Treasury yield is moving toward 4.70% in the short term.
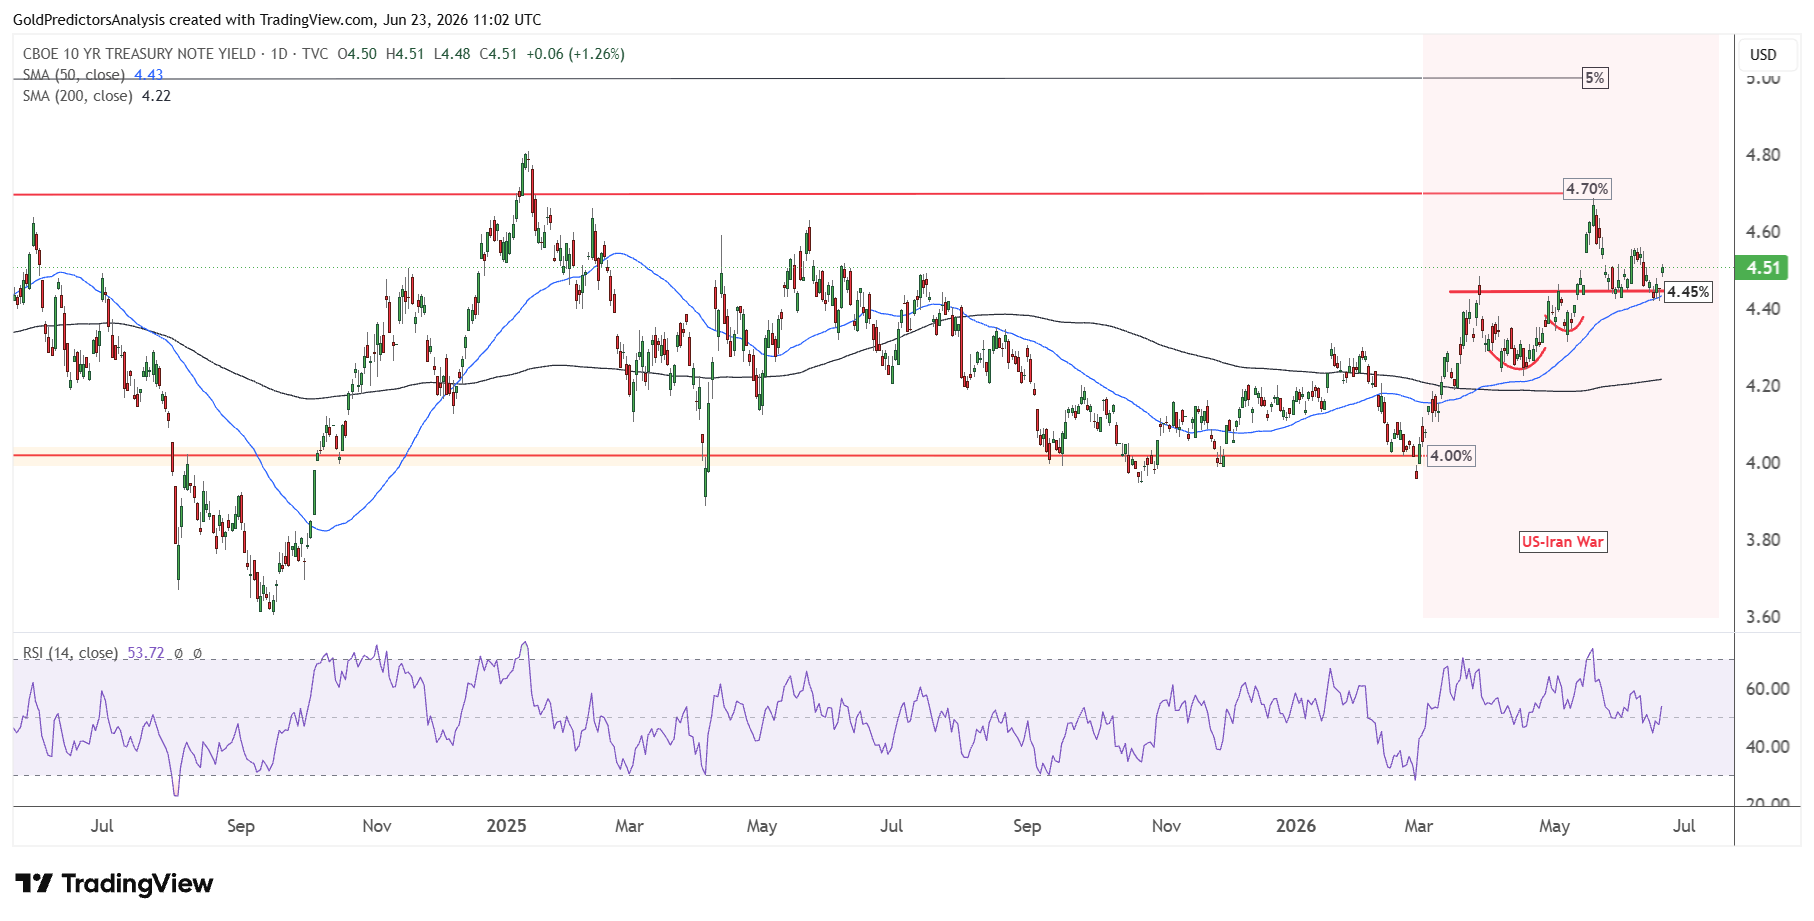
A break above 4.70% will likely initiate a strong move toward the 5% level. This strength in US Treasury yields indicates further weakness in precious metals in the short term.
Platinum Tests $1,600 as Deeper Correction Builds
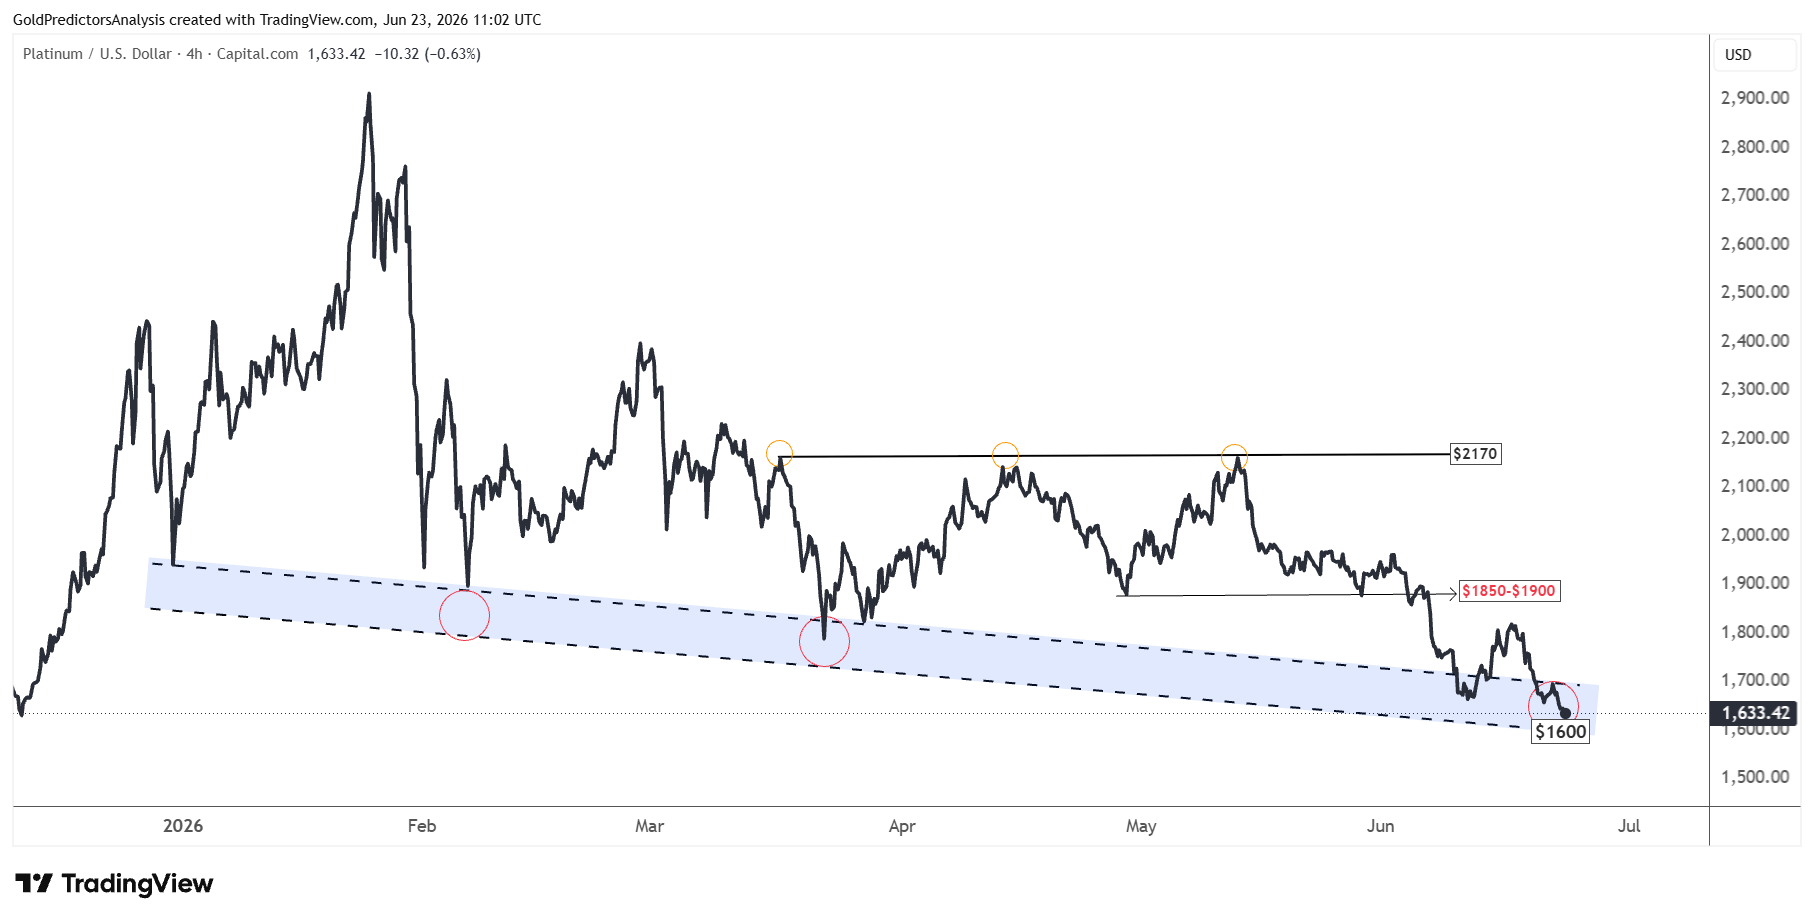
The short-term price action for platinum remains under bearish pressure as the price has been consolidating within the support zone of $1,600 to $1,700.
The rebound in platinum prices in the second week of June 2026 failed to break above $1,900 and again pushed prices lower toward $1,600. This indicates that prices are losing momentum and look set to move further downside in the short term. A break below $1,600 will likely push prices further downside with greater momentum.
The importance of $1,600 to $1,700 is also evident on the long-term monthly chart which shows that the drop from the peak of around $2,900 has triggered a strong drop toward the $1,600 level.
The formation of sharp shadows on the monthly candles of January 2026 and May 2026 indicates further downside in June 2026.
The next support after $1,600 is $1,530. If the price breaks below $1,530, it will likely push platinum prices toward $1,350. A break below $1,350 will push platinum toward $1,200.
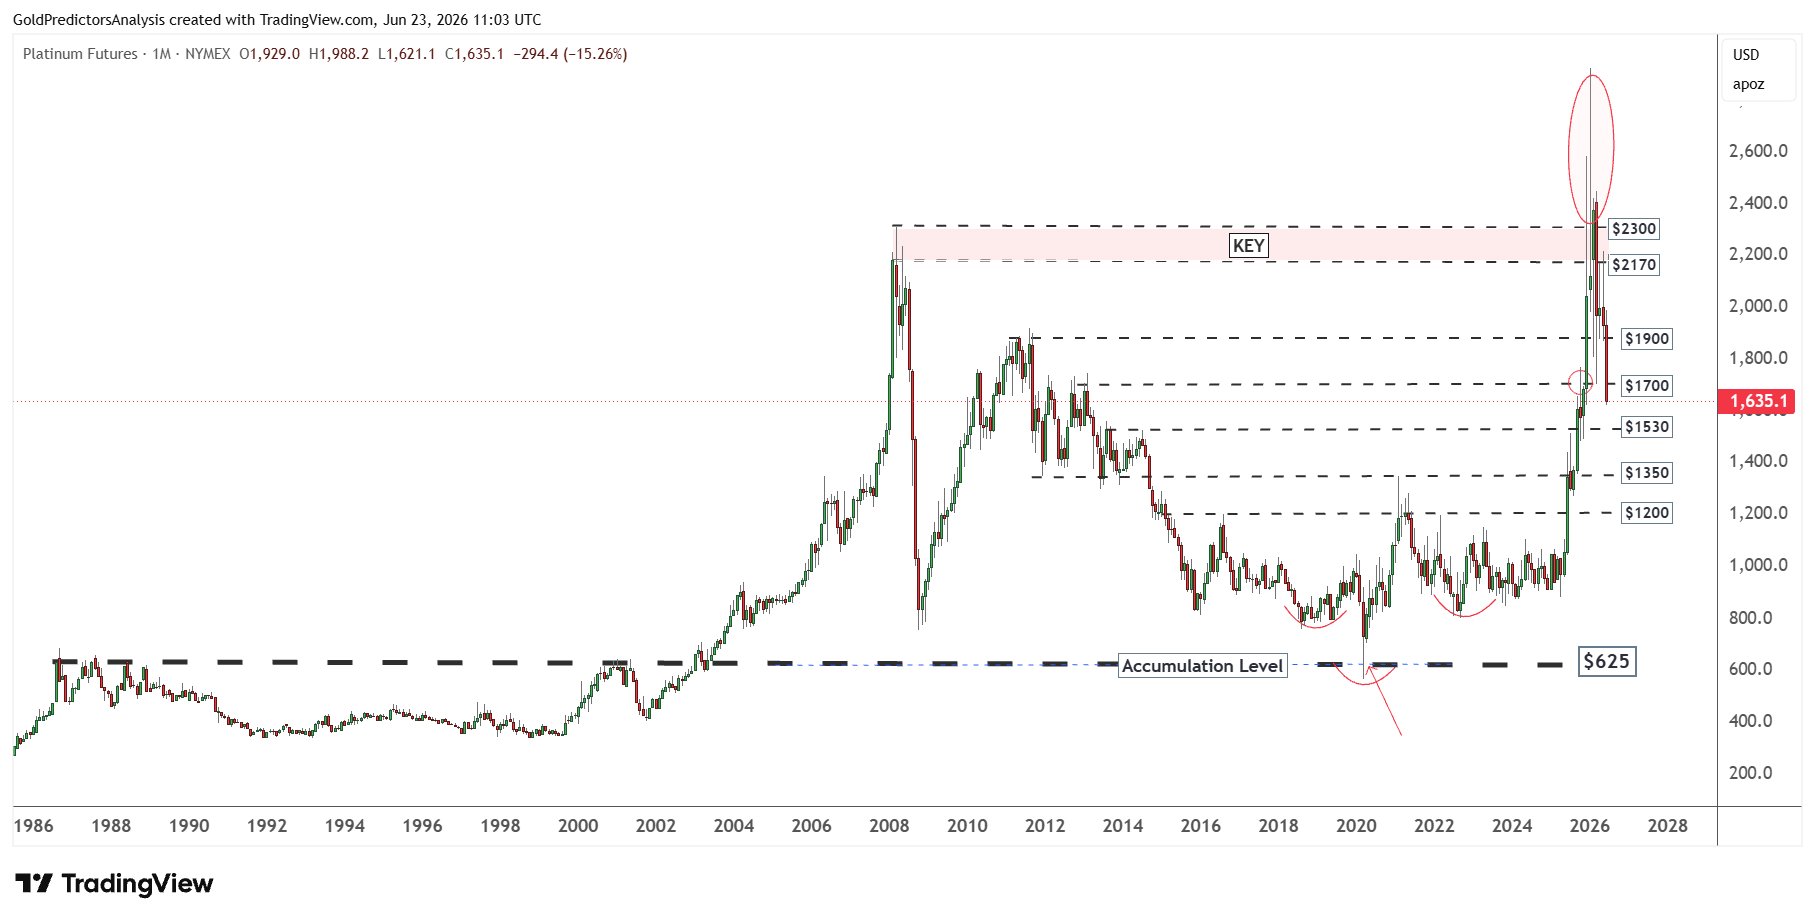
The $1,200 to $1,350 remains the pivotal zone in platinum prices. As long as prices remain above $1,200, the long-term trend in platinum will likely remain higher.
Once this correction is over, prices will likely revert higher again and move toward the $2,300 region. Therefore, this correction is considered a strong buying opportunity in the $1,200 and $1,350 range.
Platinum to Gold Ratio Signals More Short-Term Weakness
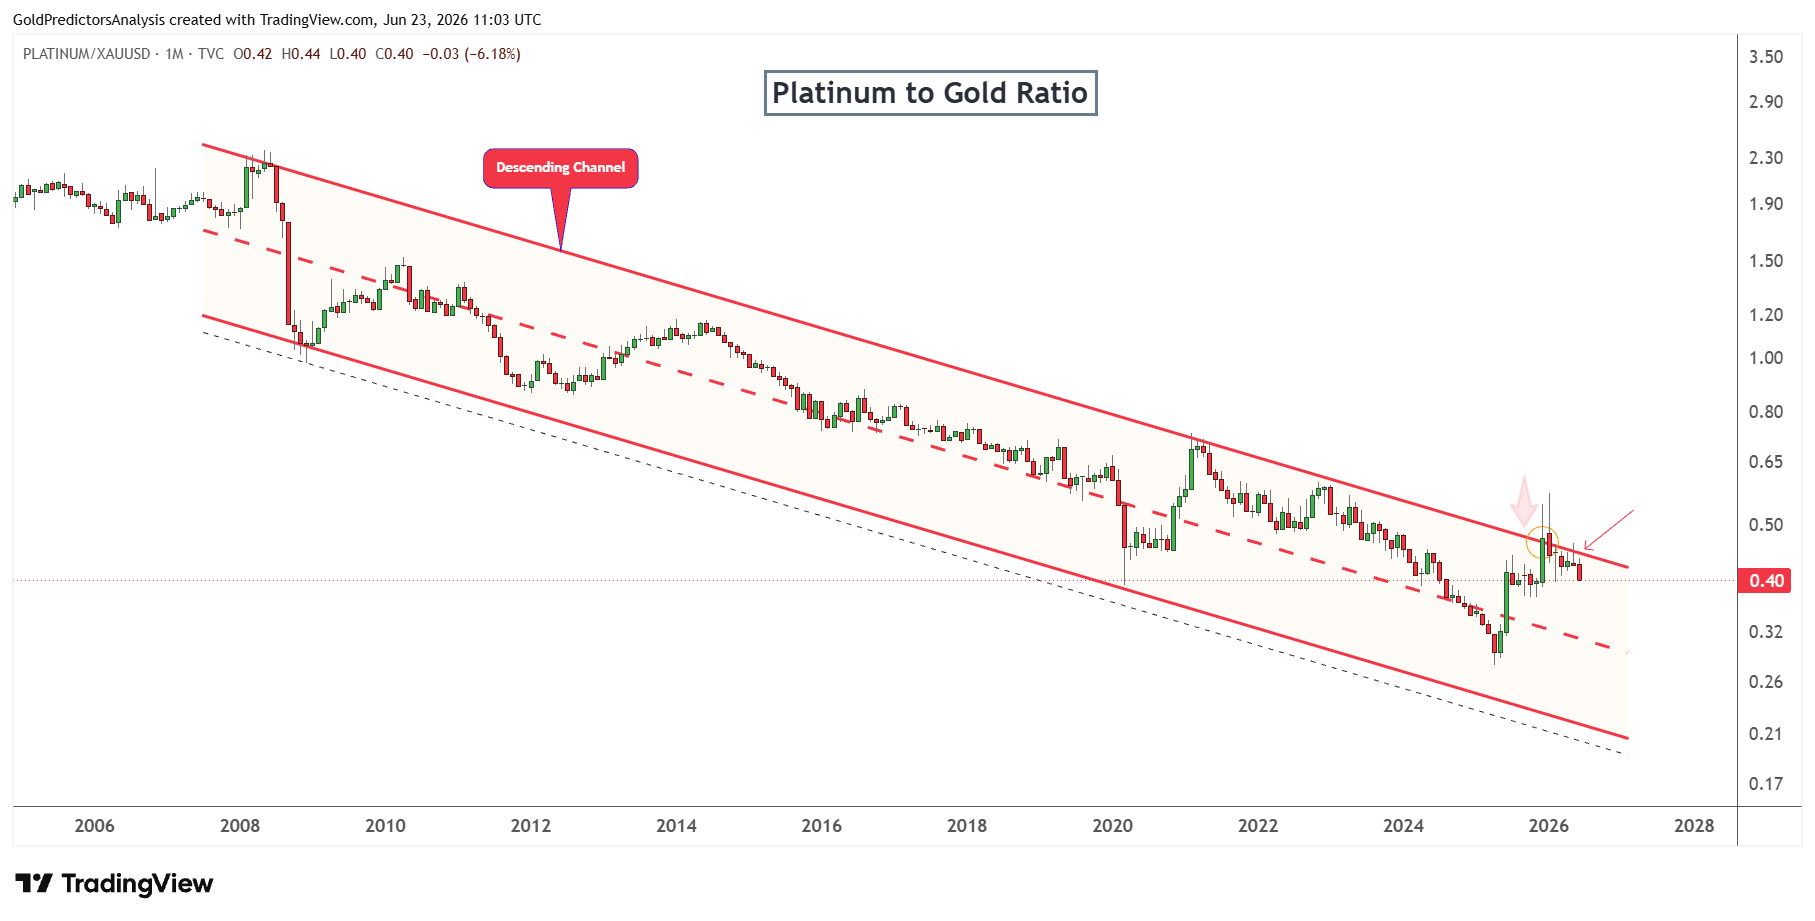
The platinum-to-gold ratio also confirms the short-term weakness in platinum prices. The ratio has hit the 8-year descending channel for the first time since February 2021.
The platinum-to-gold ratio spiked higher to break above this descending channel in January 2026, when platinum prices peaked. But the failed breakout triggered a drop back lower.
The formation of a peak in the ratio at 0.57 and then the consolidation for the next five months suggests that platinum prices may continue to drop to push the ratio to the 0.35 level.
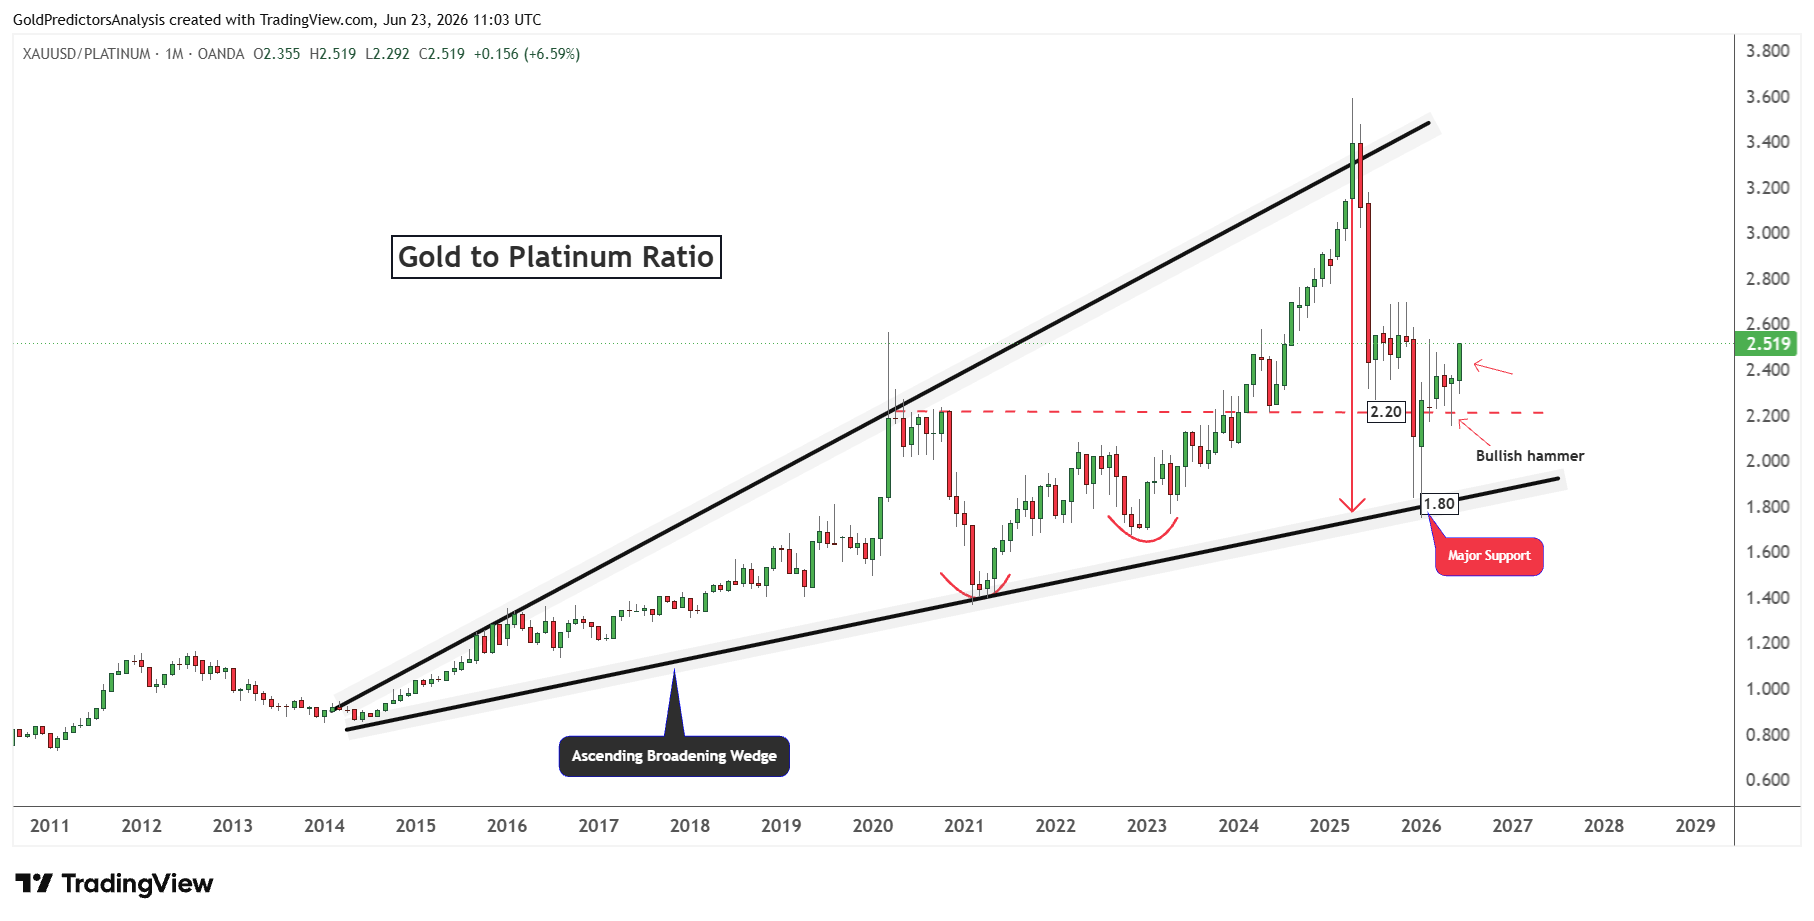
Another confirmation comes from the gold-to-platinum ratio. This ratio has hit the long-term support of 1.80. This support comes from the ascending broadening wedge pattern. After hitting the major supports, the ratio created strong bullish hammer candles in January 2026 and May 2026.
These bullish hammer candles above the long-term support region indicate that the long-term support in the ratio is strengthening.
The strengthening of the gold-to-platinum ratio indicates that platinum prices will underperform the gold prices.
Dollar-Platinum Correlation Points to Long-Term Buy Zone
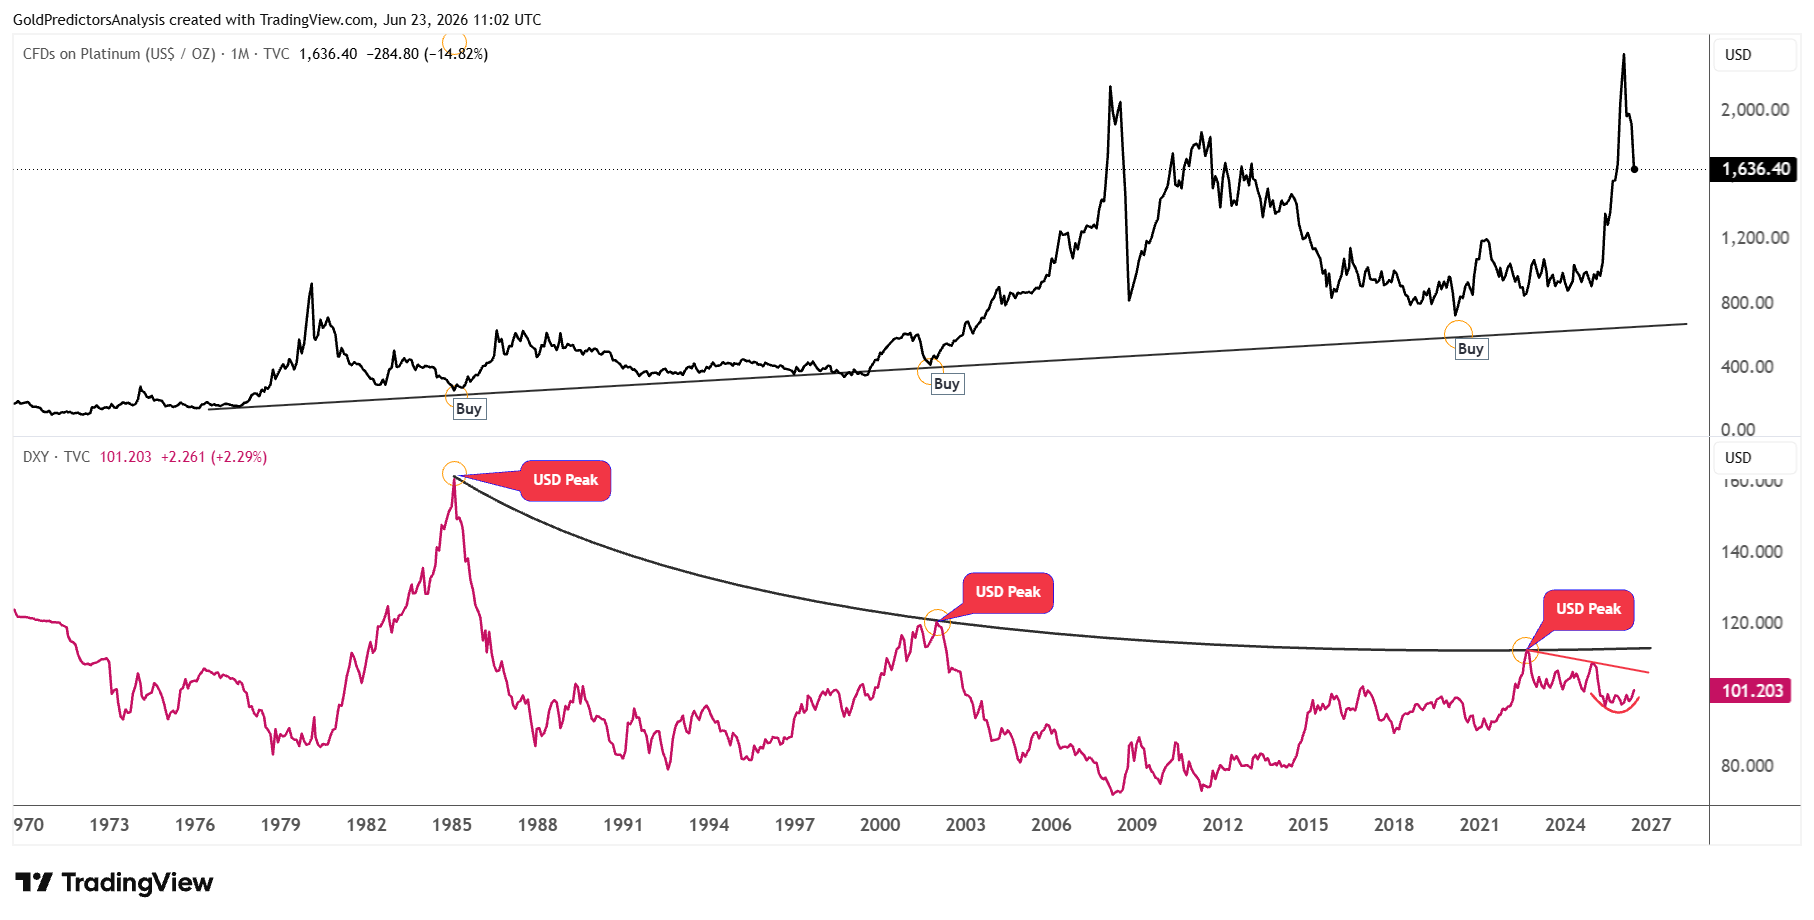
The correlation between the US Dollar Index and platinum prices is observed in the long-term chart below. Every peak in the US Dollar Index has formed a strong long-term buy signal in platinum prices.
The peaks in US Dollar Index in 1985, 2001 and 2022 triggered strong buy signals in platinum prices above the rising trend line.
However, the US Dollar Index has remained in a negative trend since the 2022 peak and consolidated lower. This triggered a strong surge in platinum prices that was overextended above the $2,300 resistance.
But after forming strong consolidation in the US Dollar Index between 96 and 100.50 during the past year, a breakout above 100.50 has triggered a strong move.
This strength in the US Dollar Index has triggered a sharp drop in platinum prices from $2,919 to $1,600. This is nearly a 45% drop from the recent peak.
This indicates that the platinum price remains under bearish pressure in the short term and is consolidating to move further lower toward the long-term support area of the $1,200 to $1,500 zone.
Bottom Line
Platinum remains under pressure as the US dollar and Treasury yields continue to rise. The short-term trend for precious metals is bearish as the US Dollar Index broke above 100.50 and the 10-year yield holds above 4.45%. The platinum price failed to hold the $1900 and return to the key short-term support of $1600. A break below this level could push the prices to $1,530, $1,350 and $1,200 as long-term support zones.
But the current weakness could make this a long-term buying opportunity when the correction is over. The ratios between platinum and gold suggest that the platinum might lag gold prices in the short term but the major support zone between $1,200 and $1,350 is very significant. A peak in the US dollar and a pullback in US Treasury yields would be the initial sign that platinum is preparing for a new rally to the $2,300 area.
Read more: Fed Risk Pressures Platinum at Support Zone