


Silver (XAG) prices remain under pressure as the stronger US dollar, weaker risk sentiment and lower oil prices weigh on commodities. In my view, this correction is moving silver toward a major support zone between $50 and $55, where buyers may return if the dollar loses momentum. This article presents the key macro drivers, technical support zones, silver to gold ratio levels that may define the next move in silver.
Lower Oil Prices and Softer Yields Drive Silver Pullback
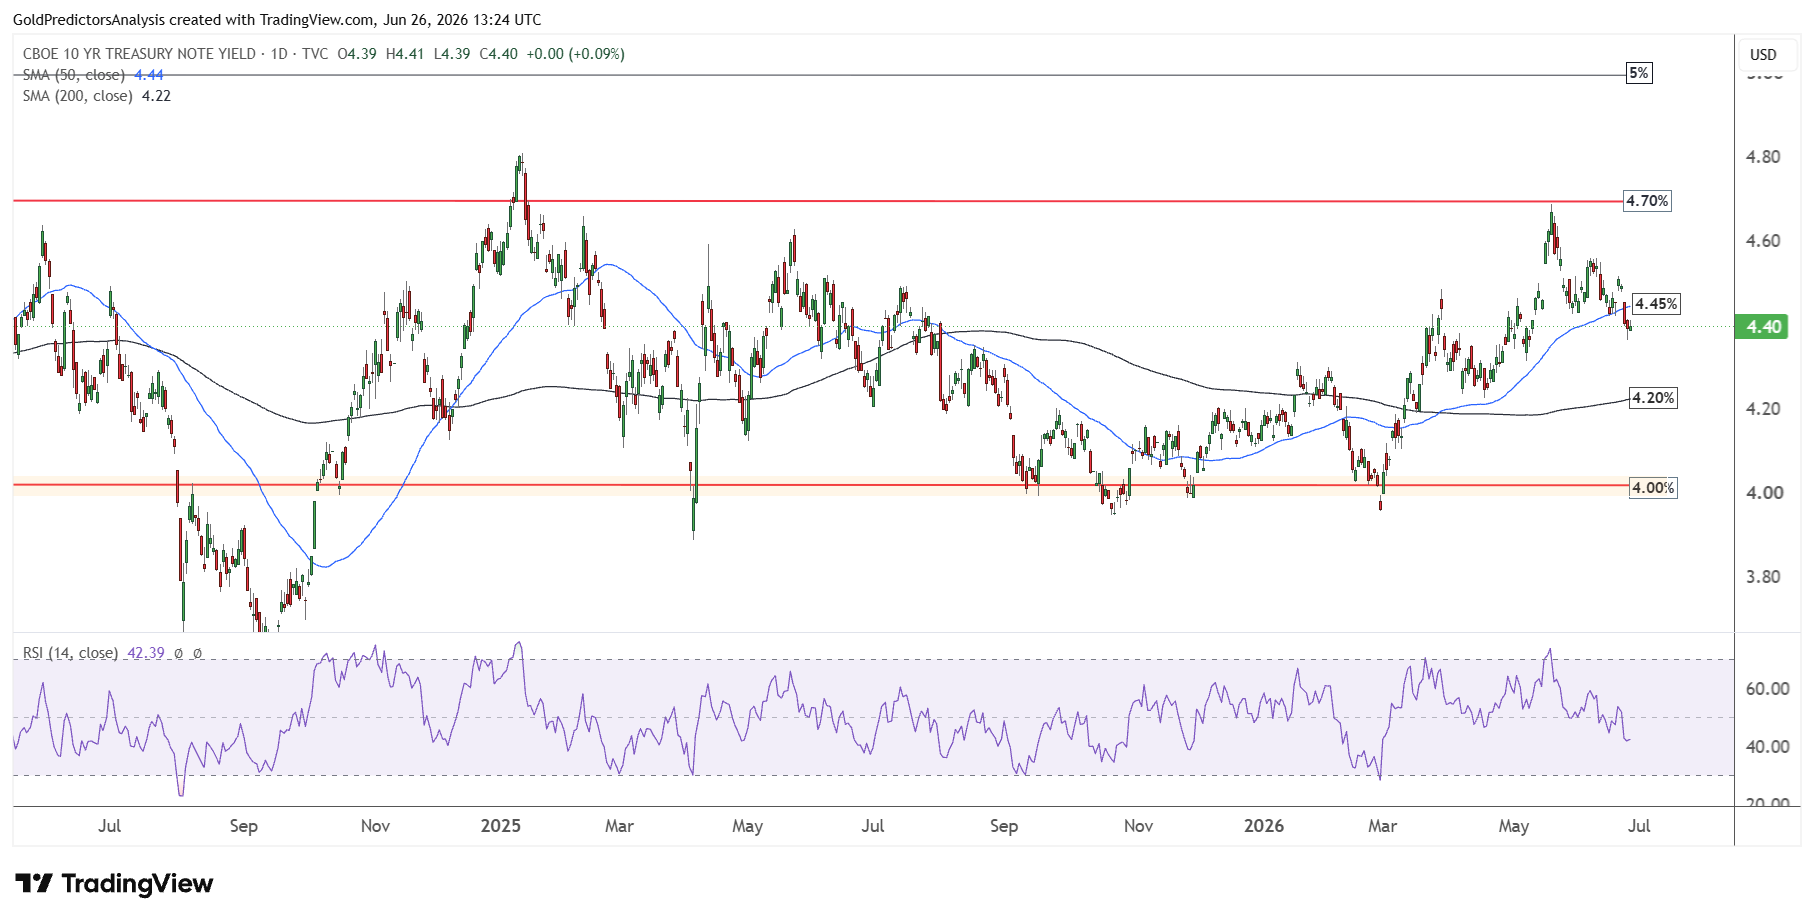
Silver remains under pressure as the global market enters a more defensive phase. Brent crude futures are trading under $75 a barrel after traders bet on smoother traffic through the Strait of Hormuz. This drop in oil prices eased the inflation concerns in the near term. It has also driven down the long-term Treasury yields towards the primary support zone of 4.20%. The chart below shows that the 10-year US Treasury yield has broken the 50-day SMA and continues to drop to the 200-day SMA at 4.20%.
But the drop in oil prices does not guarantee that the geopolitical risk has gone away. The market is discounting a clean reopening of the Strait of Hormuz, but the situation still remains fragile. The tankers still require time to get back on track, which keeps the energy markets volatile. The complete recovery in oil flows may be affected by minesweeping activity, tanker repositioning and political uncertainties in the region. This suggests that the recent commodity market weakness is a short-term reaction rather than a long-term commodity market shift.
Stronger Dollar and Weak Risk Sentiment Weigh on Silver
On the other hand, the breakout in US dollar index at 100.50 has produced a negative impact on the silver prices. The dollar is strengthening as traders expect more aggressive short-term interest rate hikes with the new Fed chairman, Kevin Warsh. Moreover, Kevin Warsh has yet to demonstrate consistent policy position. The US dollar index is correcting from the 101.80 back towards the 100.50. This correction is fueling a rebound in silver prices. The US dollar must hold the 100 level to keep the silver prices under pressure.
Silver Price Forecast
Every new Silver analysis as it publishes, today's technical signal and key levels, live price — on one page.
See all Silver forecasts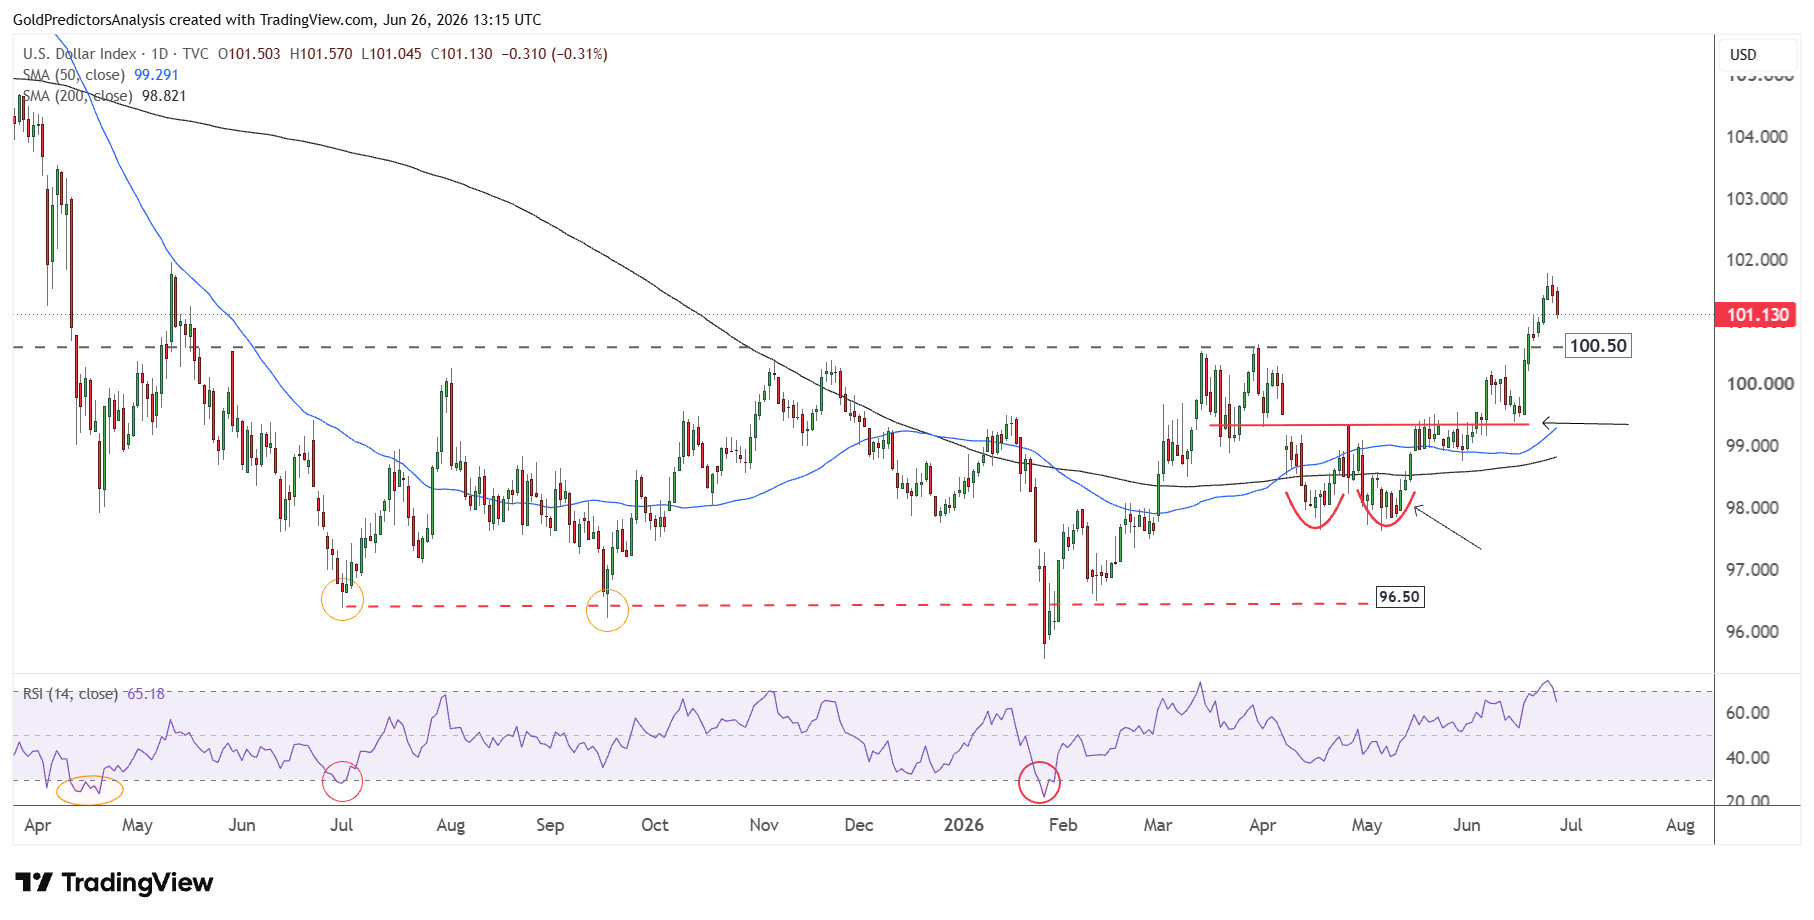
The risk sentiment is also weakening in financial markets. Bitcoin (BTC) is currently testing a big support level around $60,000. The S&P 500 is correcting from record highs and could retest the 7,000 level. This indicates that investors are shifting from risk assets. Silver is one of the elements that exhibit aggressive reactions during these changes as it has both precious metal and industrial demand. When growth fears increase and the dollar strengthens, silver may lose ground faster than gold.
Long-Term Silver Demand Supports the Bullish View
The long-term trends for silver are positive despite this short term correction. Fiscal deficits, government spending and long-term currency debasement are significant factors that affect precious metals. Central banks also continue to buy gold (XAU) due to low prices which supports the overall precious metals complex.
The long-term structural demand for silver also supports the bullish view. The need for energy security has grown after the Persian Gulf War. Countries can still develop strategic reserves and diversify their oil supply risks. This shift can support the long term investment in electric vehicles, solar power and nuclear energy. Silver remains important in this transition as it is widely used in clean energy technologies and other industrial applications.
Therefore, the ongoing silver correction should be viewed in two different timeframes. The weak risk sentiment, lower oil prices and a stronger dollar put bearish pressure on silver prices in the short term. But geopolitical uncertainty, currency debasement and clean energy demand support the bull thesis in the long term. This macro backdrop aligns with the technical setup where silver is currently moving towards a big support and buy point.
Silver Nears the $50–$55 Buy Zone
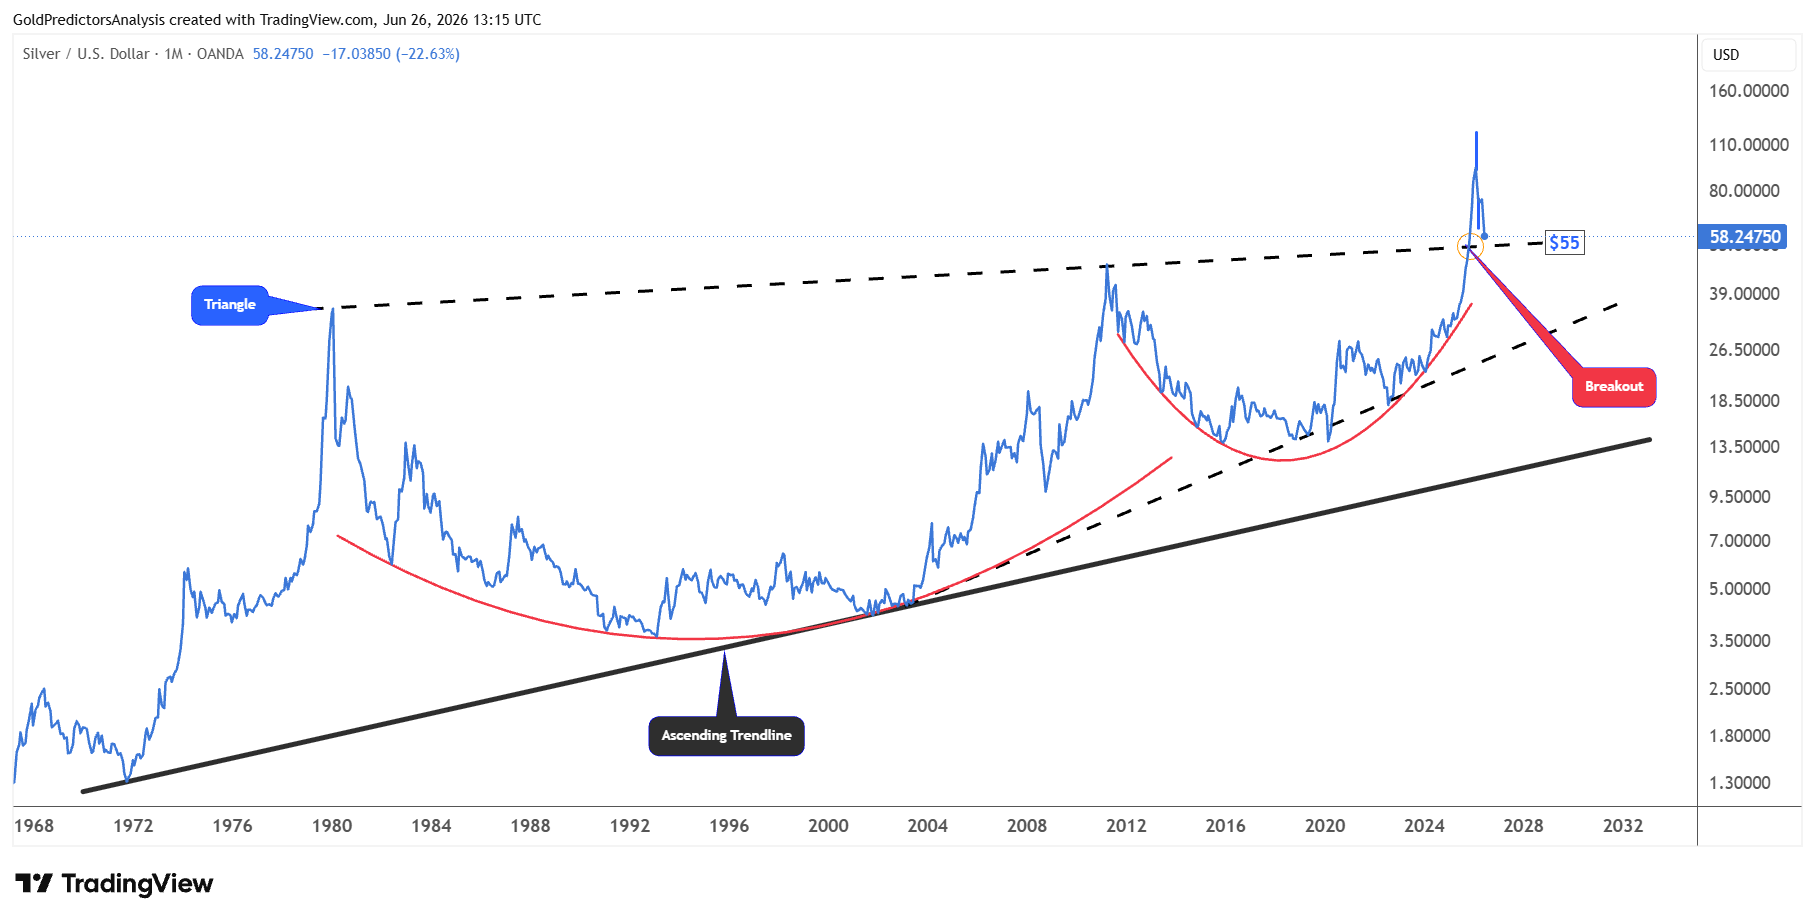
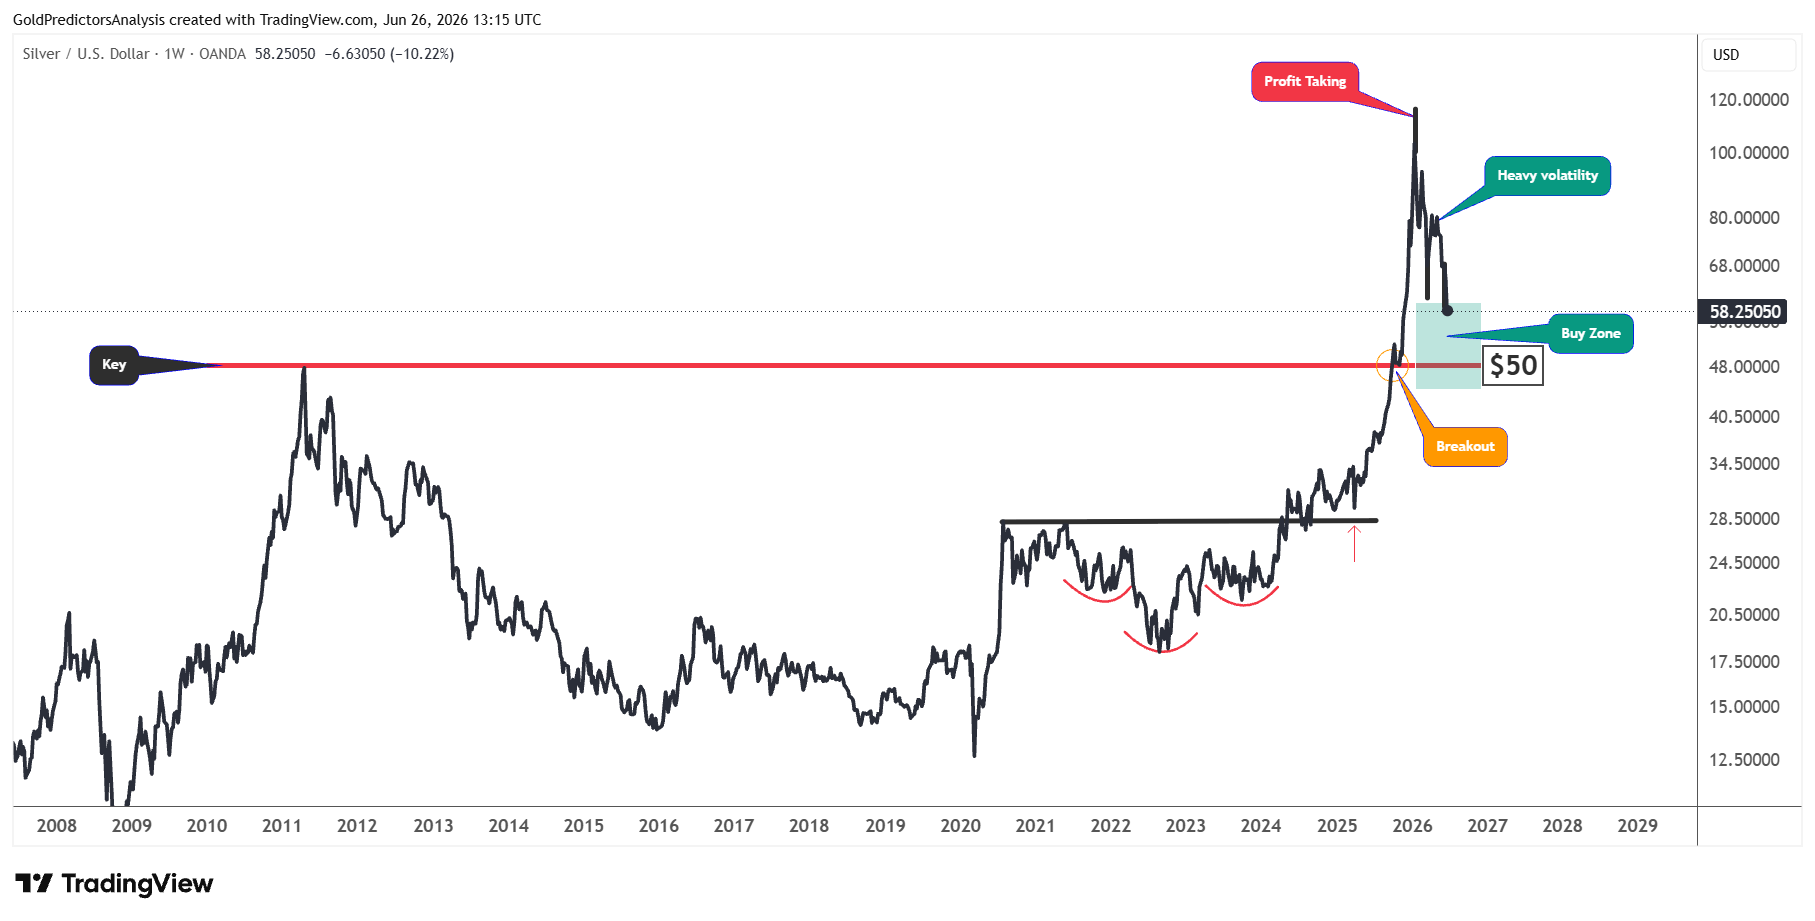
The long-term price structure for spot silver shows very constructive price action. This constructive price action is observed using the formation of a cup and handle pattern from the 1980 peak to the December 2025 breakout.
After the breakout of this pattern at $50, the price spiked to $120 and is now correcting back toward the $50 breakout area. This correction will likely find a strong bottom in silver prices and trigger another rally toward new high levels.
Inverted Head and Shoulders Pattern Supports the $50 Area
To further understand the importance of the $50 area, the chart below shows the formation of an inverted head and shoulders pattern from 2021 to 2024. This pattern was broken in 2024 and triggered a strong surge higher.
The profit taking at $120 is pushing prices toward the $50 area, which is considered a strong buy zone. This buy zone now lies between $45 and $55, where the price has already hit strong support. If the prices hold this support of $50, it may trigger another rally toward the $90 area in the short term.
Short-Term Wedge Break Keeps Pressure on Silver
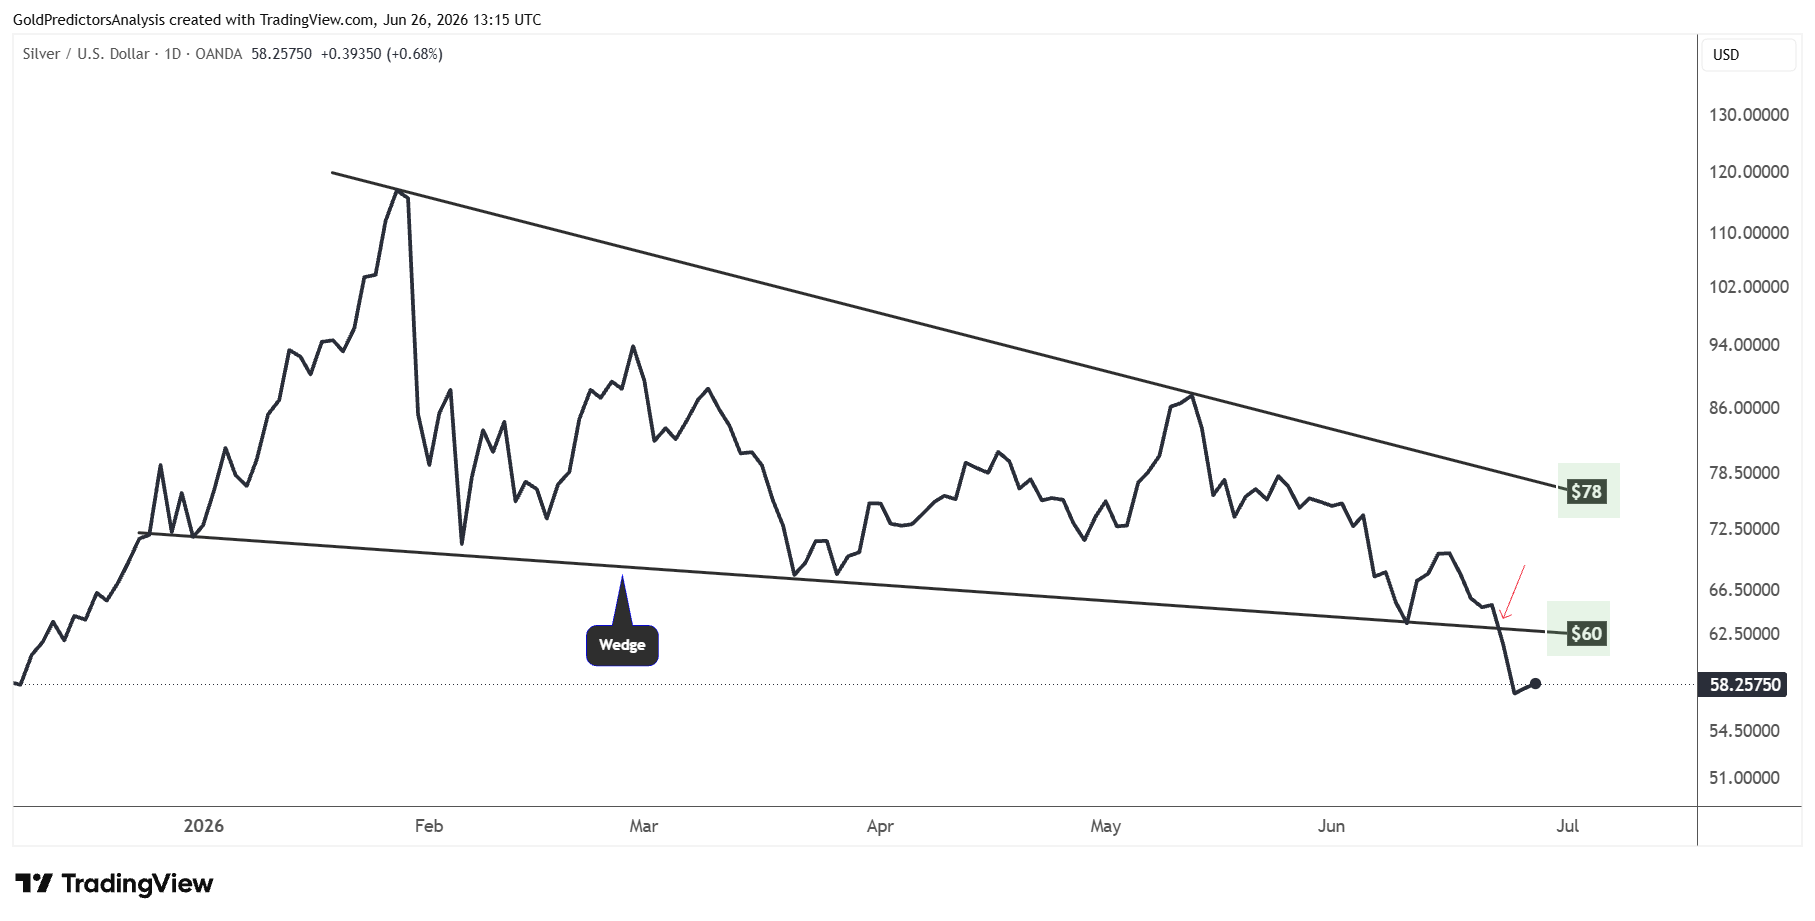
The short-term price action is defined by the formation of a wedge pattern in 2026. The spot silver price is compressing between $60 and $78 as the price approaches the end of this wedge pattern. A break below $60 has triggered a strong drop toward $55 in the spot silver market. But if the spot silver price remains below $60, silver prices may remain under pressure in the short term. A break above $72 will likely confirm that the bottom is formed.
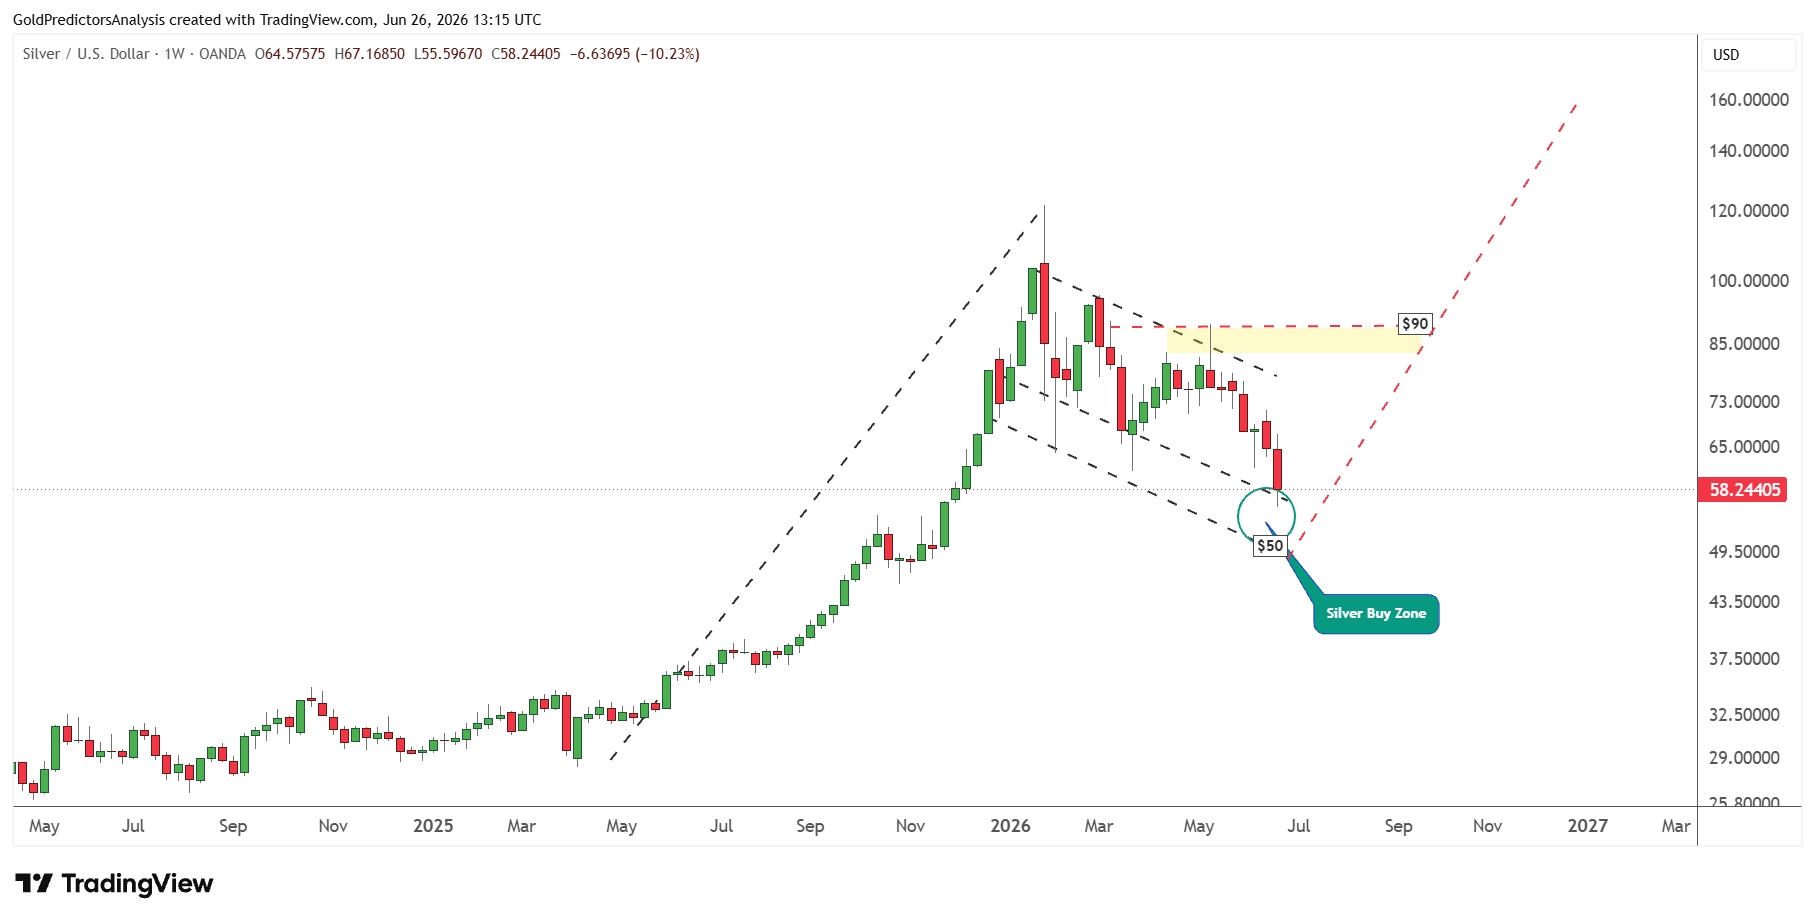
This drop in the silver market was expected as discussed in the previous article. The formation of a bearish hammer candle at the $90 resistance triggered this drop toward the $50 area. Now, the price has reached the strong support zone between $50 and $55. A slight push down toward $50 may trigger a strong rebound. But if the prices rebound from current levels and close above $72, it may trigger a rally to $90.
Silver-to-Gold Ratio Points to a Rebound Zone
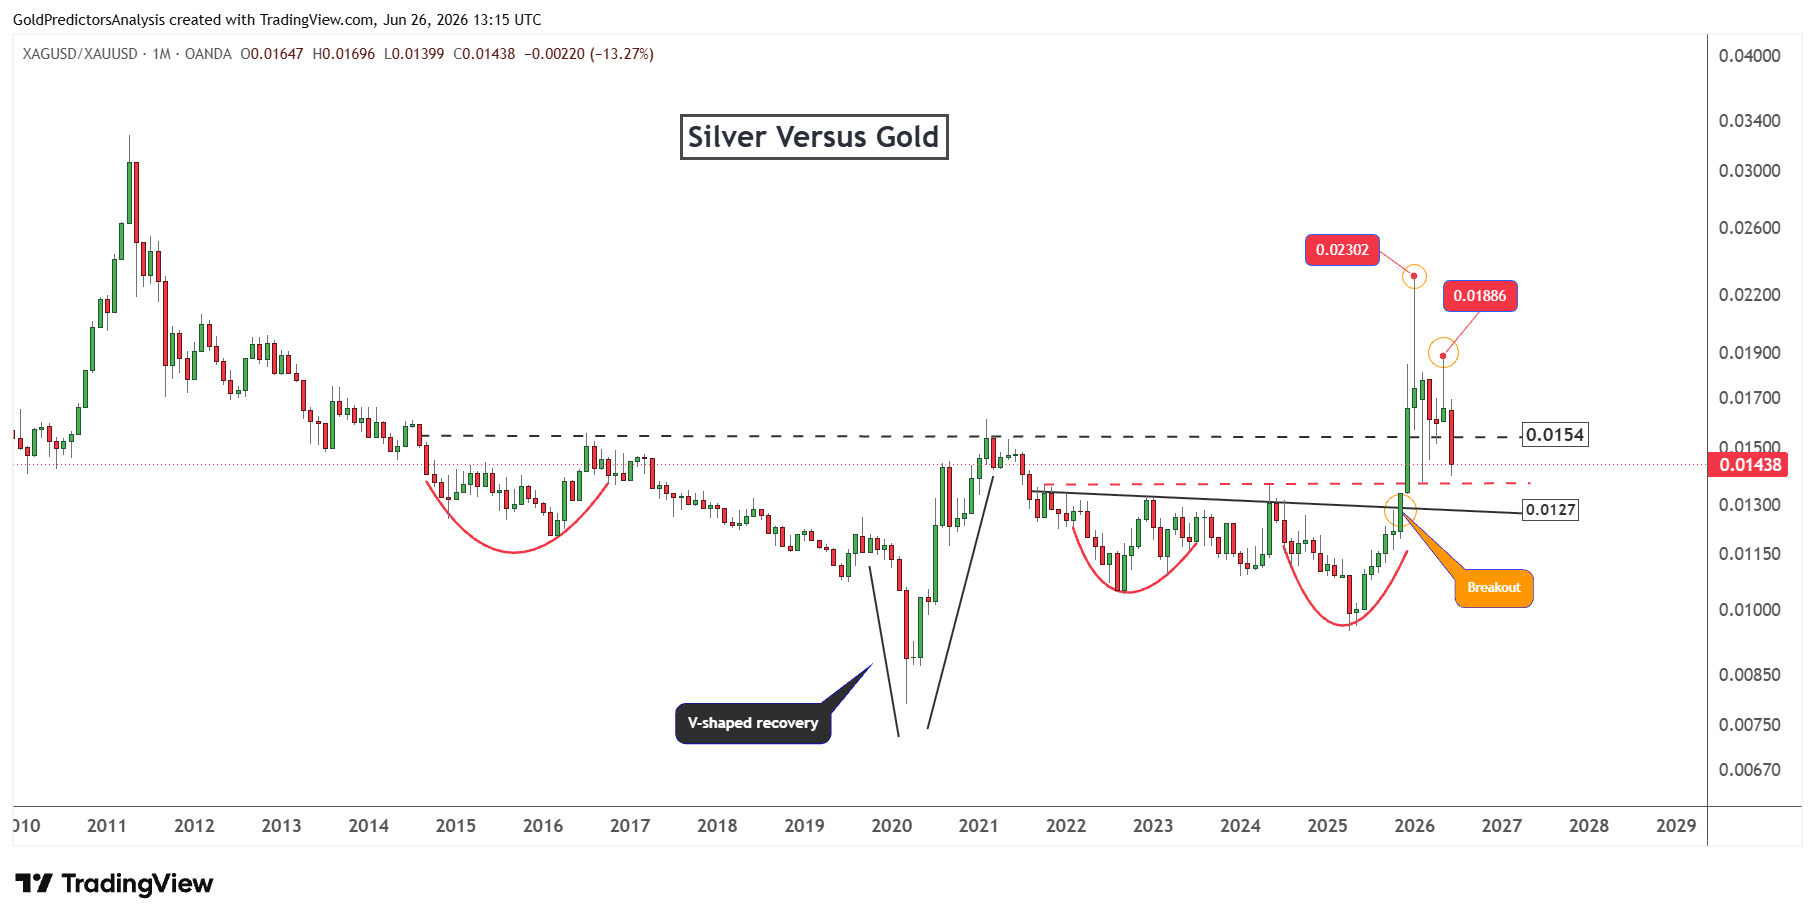
The long-term outlook for the silver-to-gold ratio shows that the ratio peaked in January 2026 and May 2026 at 0.023 and 0.018, respectively. These peaks coincided with the silver price peaks that triggered a strong drop.
Now, the ratio is correcting back toward 0.0127, which is strong support. If the ratio hit the 0.0137 and 0.0127 levels, it may trigger a rebound in silver prices.
The overall price action in the silver-to-gold ratio remains constructive, which supports a bullish view of silver prices. This bullish price action is supported by the formation of V-shaped recovery in March 2020 and then bullish price action from 2022 to 2025.
What is Next in Silver
Silver remains under pressure in the short term as a stronger US dollar, lower oil prices and risk sentiment weigh on the metal. The Treasury yields have declined, which may ease some pressure in the silver market, but the breakout in the US dollar from 100.50 keeps the metal under near-term pressure. The US dollar is now dropping back towards the 100.50 breakout, which may trigger a rebound in silver prices from $55 to $60. But if the US dollar holds the 100 level and rallies again, it could send silver down to $50.
The geopolitical risk factor has not been eliminated. The reopening of the Strait of Hormuz may take some time, and new tensions in the region can easily restore volatility to energy and metals markets. But the rising fiscal deficits and the long-term demand for clean energy further support the bull case. Overall, the spot silver price must break above the $72 to ease the bearish pressure and rally back to $90.
Read more: Silver Eyes Next Rally as Copper Lags