


DAX
The first place I’m looking at is Germany. The DAX initially dipped during the trading session, but it’s got a little bit of resilience here. Slower growth continues to be a bit of a problem in Germany. Keep in mind that the stats reported just last week showed that third-quarter GDP increased by 0.2% quarter over quarter, after 0.3% in the second quarter and 0.4% in the first.
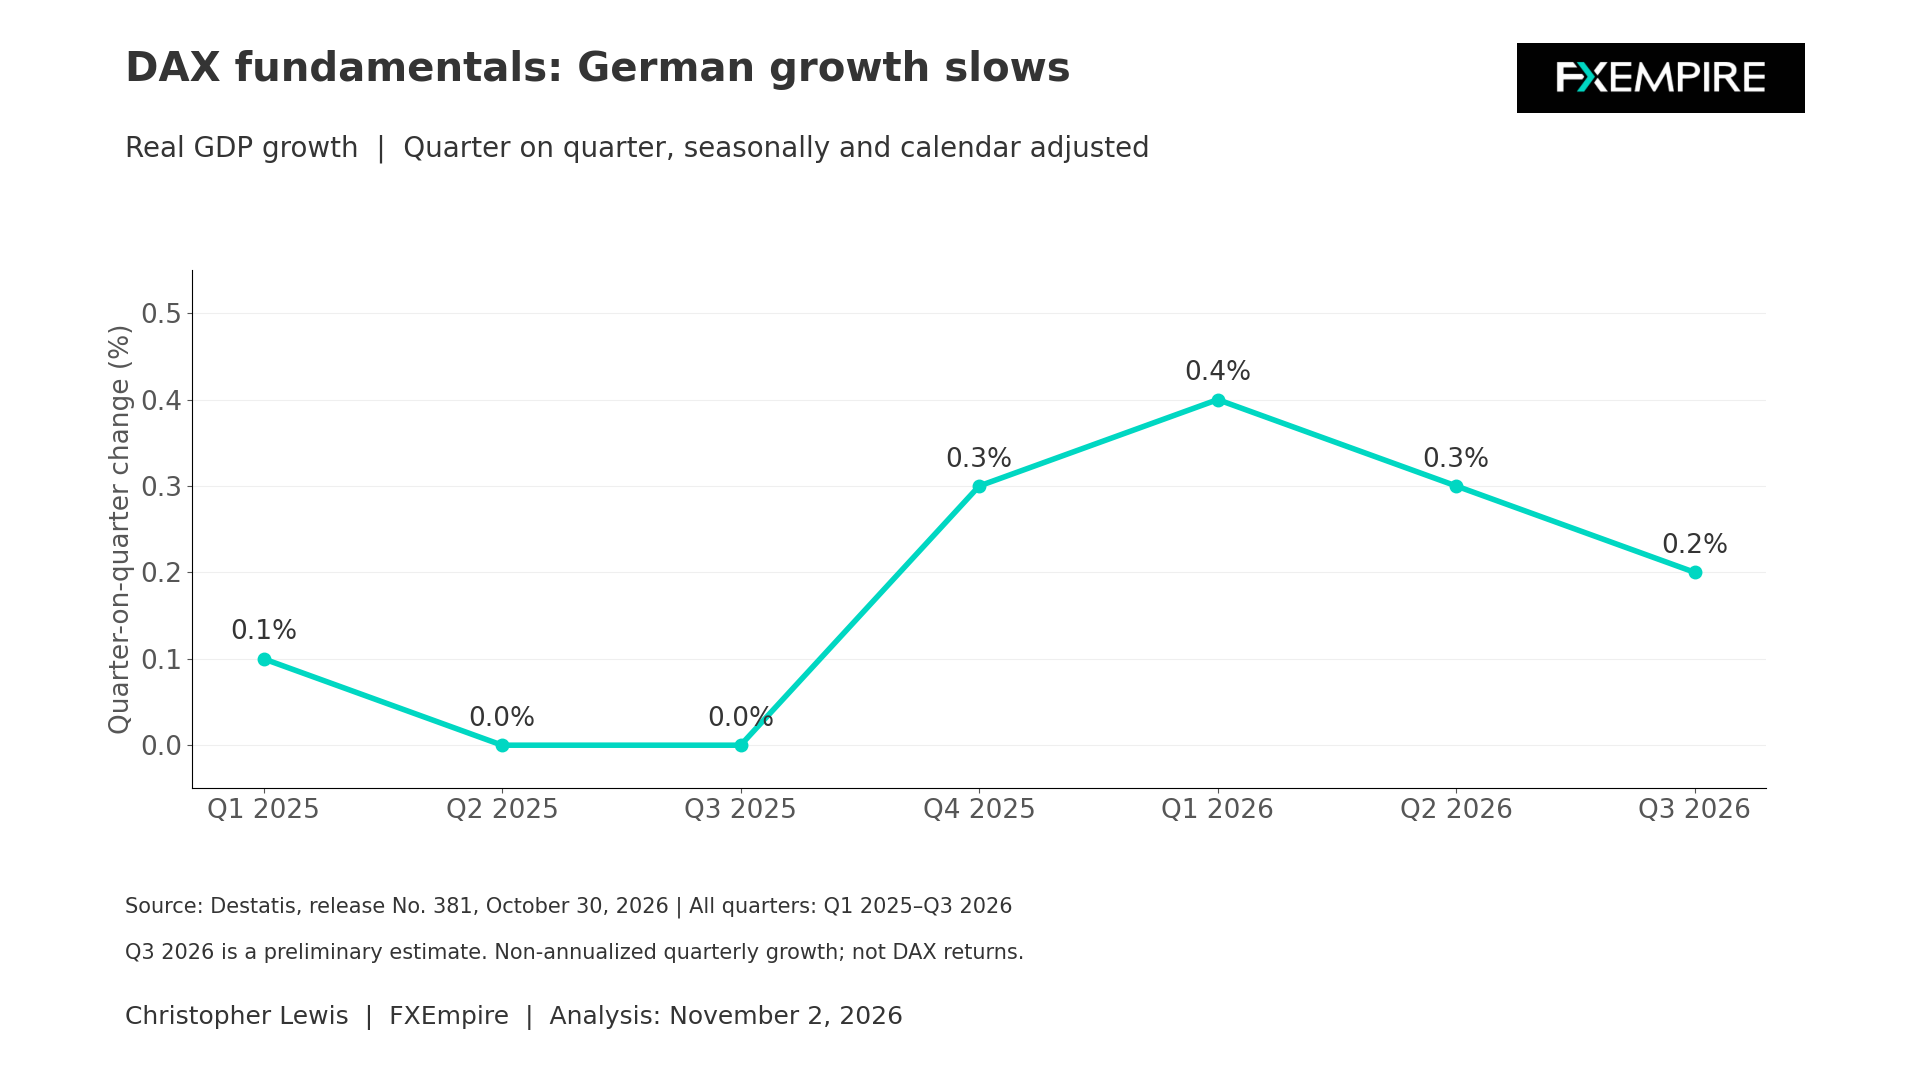
Germany is slowing down, but consumption has edged higher, capital formation is declining, and export momentum is slowing. These are not the greatest figures out there. That being said, the interpretation would be that a growth backdrop remains supportive but offers limited protection. Therefore, I think we’ve got a situation where short-term dips continue to get bought into, but maybe not with quite the gusto that we had seen before that report. In fact, we have slowed down since then.
The inflation numbers from Friday, being advanced CPI, were 2.8% year over year. That does help. Core inflation was 2.1%, a little cooler than what people had worried about, most of it, of course, being energy. They were about 12% higher than they were last year.
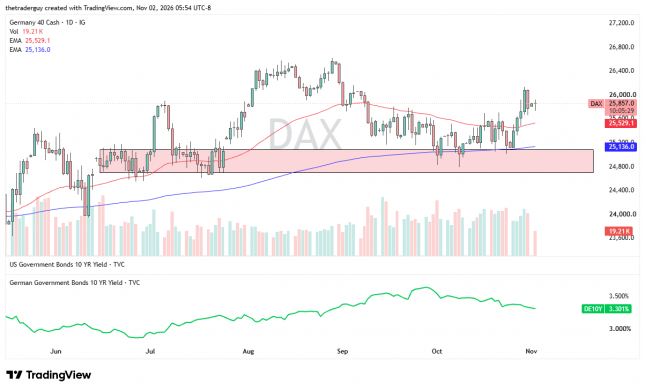
Ultimately, I do like buying dips for short-term bounce plays. I’m not looking for anything more than that. It drops; I’m looking to pick up maybe 100 euros and get out of there.
S&P 500
The S&P 500 faces somewhat similar tension. Solid economic activity supports revenues, but persistent inflation is a thing. The October 29 advance estimate of GDP was 3.4% in the United States annualized, up from 2.2% in the second quarter. That is a good sign, and that might be part of what’s giving us a little bit of constructive momentum.
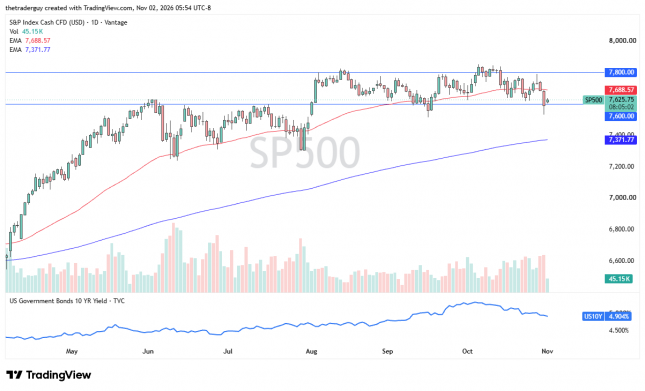
At this point, I like being long the S&P 500. I’m not looking for the world here. I just think eventually we reach toward 7,800 one way or another. Keep in mind, this is a very busy week, which, of course, culminates with the jobs report on Friday. So, a little bit of hesitation to get massively bullish, but I think we’re just going to kick around in this range.
DAX Price Forecast
Every new DAX analysis as it publishes, today's technical signal and key levels, live price — on one page.
See all DAX forecastsEUR/USD
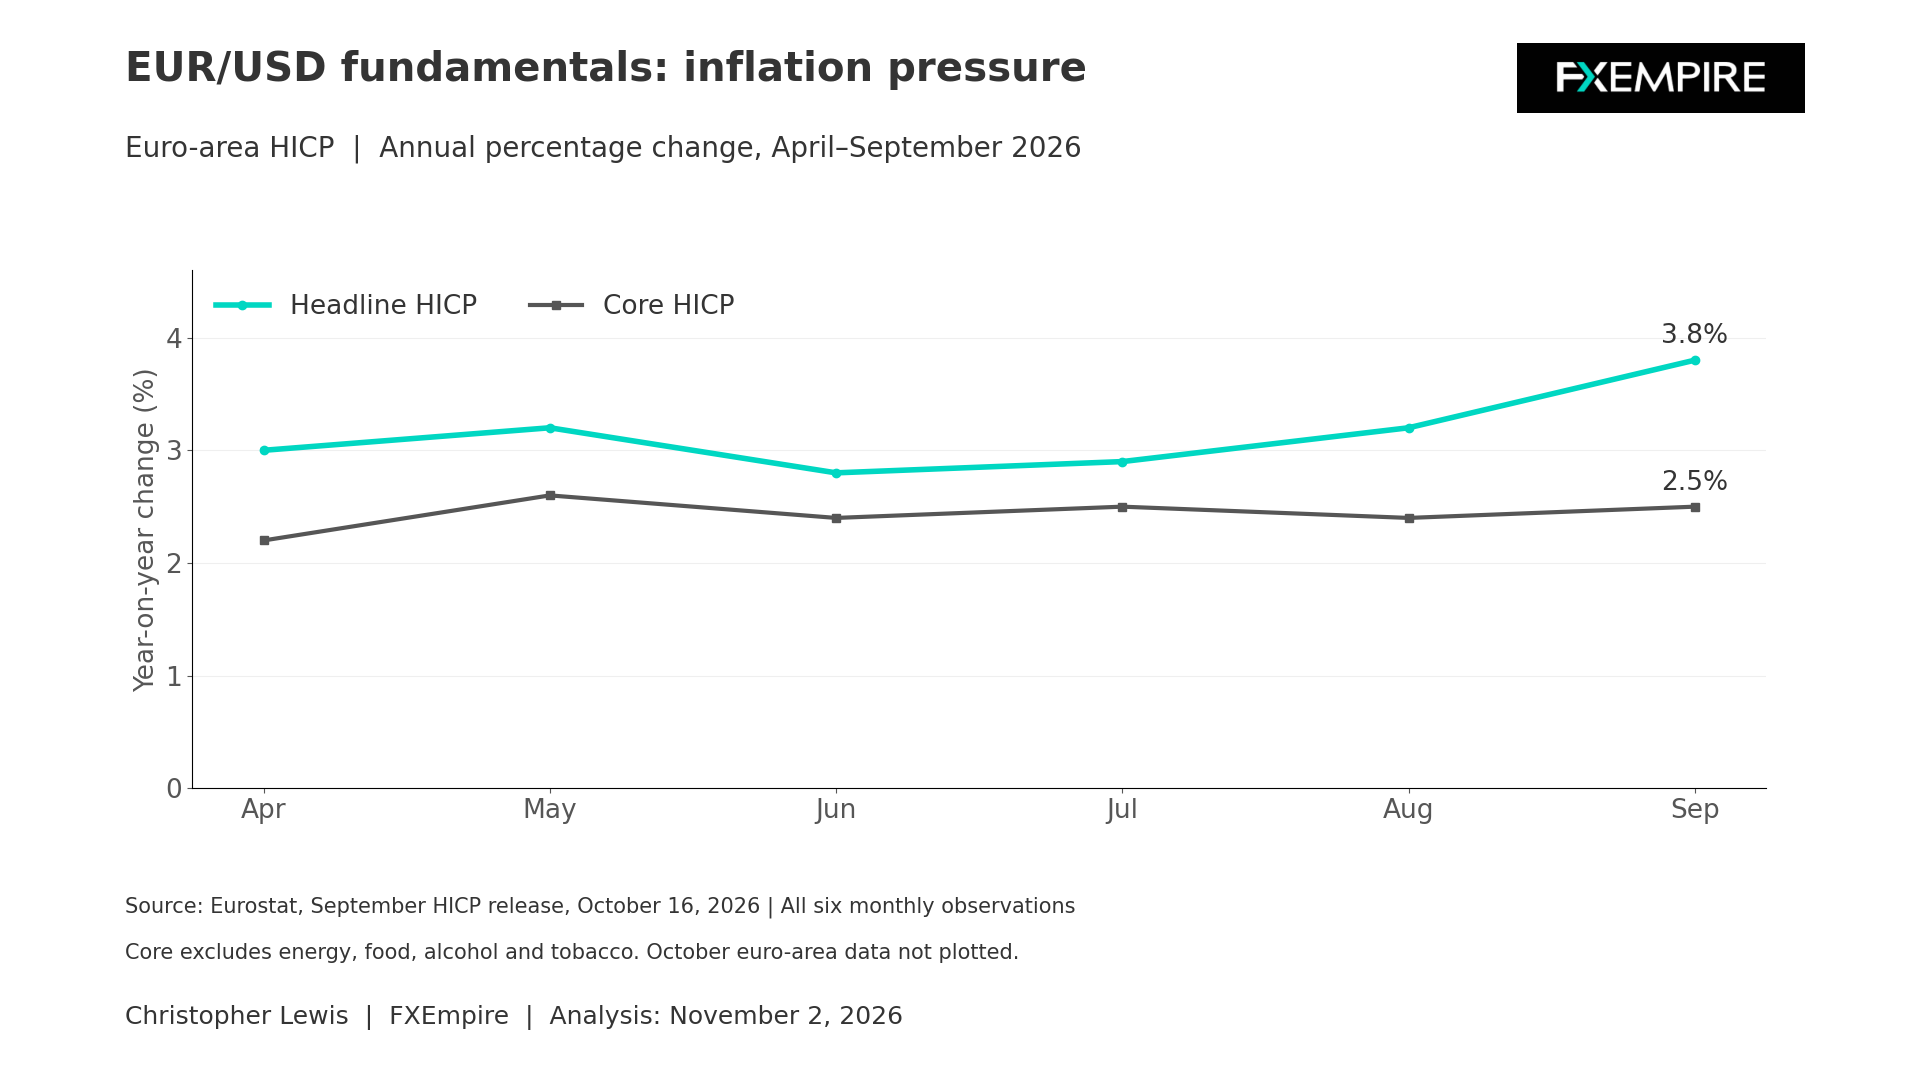
The euro has rallied quite nicely, but really a lot of this comes down to, I believe, the statement just released by the Iranians suggesting that they were willing to talk to the Americans again. Whether or not that actually produces anything is a completely different question.
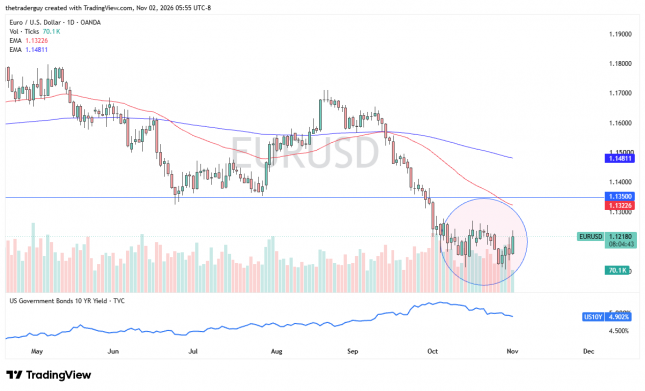
The 1.1250 level continues to be an area of resistance from everything I see. Because of this, I’m looking to fade this move right here. If we break above 1.1260, fine, I was wrong. I’ll look again at 1.1350 for cheaper U.S. dollars.
USD/JPY
Finally, the U.S. dollar against the Japanese yen continues to be a little bit noisy. The official development that is the most recent was the Bank of Japan suggesting that they were worried about underlying inflation, but it does suggest that there might be further policy rate increases, with timing and pace depending on economic realities.
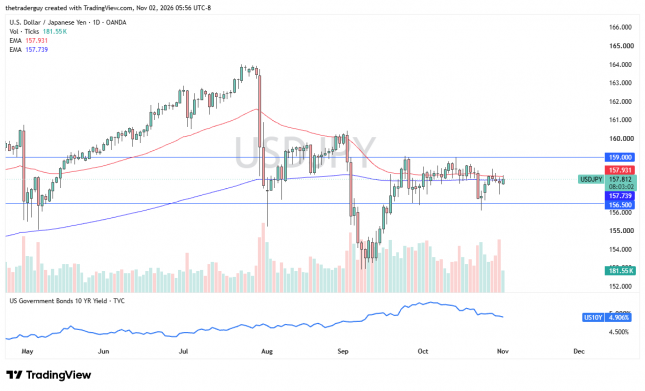
With that being said, the Federal Reserve is also looking to hike rates probably in December. So, I still believe that the carry trade is a thing, although it’s very possible that it is going to be challenged a bit. The difference helps, but the idea that the Japanese may be tightening probably puts a little bit of a lid on it.
So again, this is going to be somewhat like the DAX for me. I’m going to be buying short-term dips for short-term trades. I do have a longer core position in a different account, but that’s an investment that’s probably not relevant here. So, little dips, little rips, sell them—probably 30 to 50 pip moves at best.