


US02Y Technical Analysis
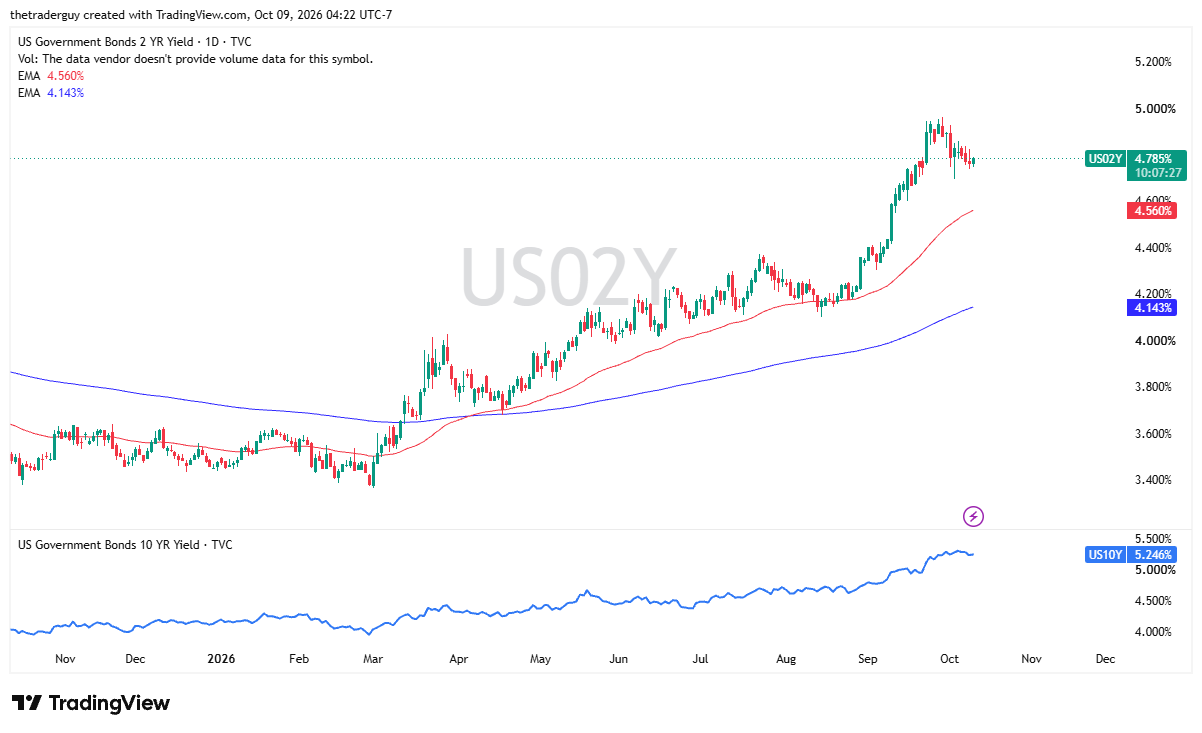
The 2-year yield is the first place I’m looking at today, as we have a lot of noise in the bond market. The bond market, of course, is a major driver of where risk appetite is going. With that being said, I think we have to look at this through the prism of whether we are starting to jump to the upside, starting to jump to the downside, or simply grinding.
Right now, it looks like we’re simply grinding. With this, I am looking to see if there’s any sudden change in attitude. It can give us an idea of where we are going. But with this recent action, it looks like the markets are simply stuck. So I’m not looking for big moves in anything at the moment.
EUR/USD Technical Analysis
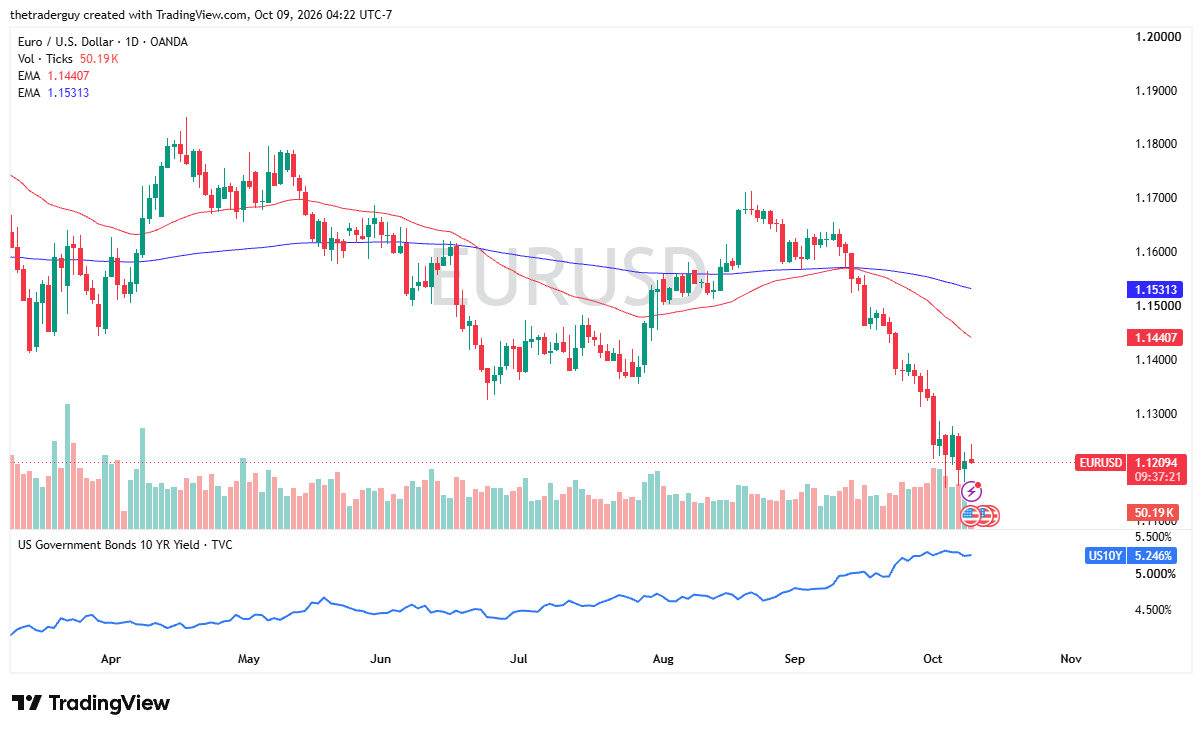
The euro has initially tried to rally but it’s rolled over again. This is the same story that we’ve been seeing for a while, with French debt and now Greek and Italian debt coming into the picture. Fiscal concerns in Europe continue to weigh upon it. We’re just hanging around the 1.12 level, and it certainly looks like we could break down a bit from here.
Short-term rallies, to me, look like selling opportunities. Again, the bond markets are fairly quiet on the other side of the Atlantic, so I am not expecting huge moves.
USD/ZAR Technical Analysis
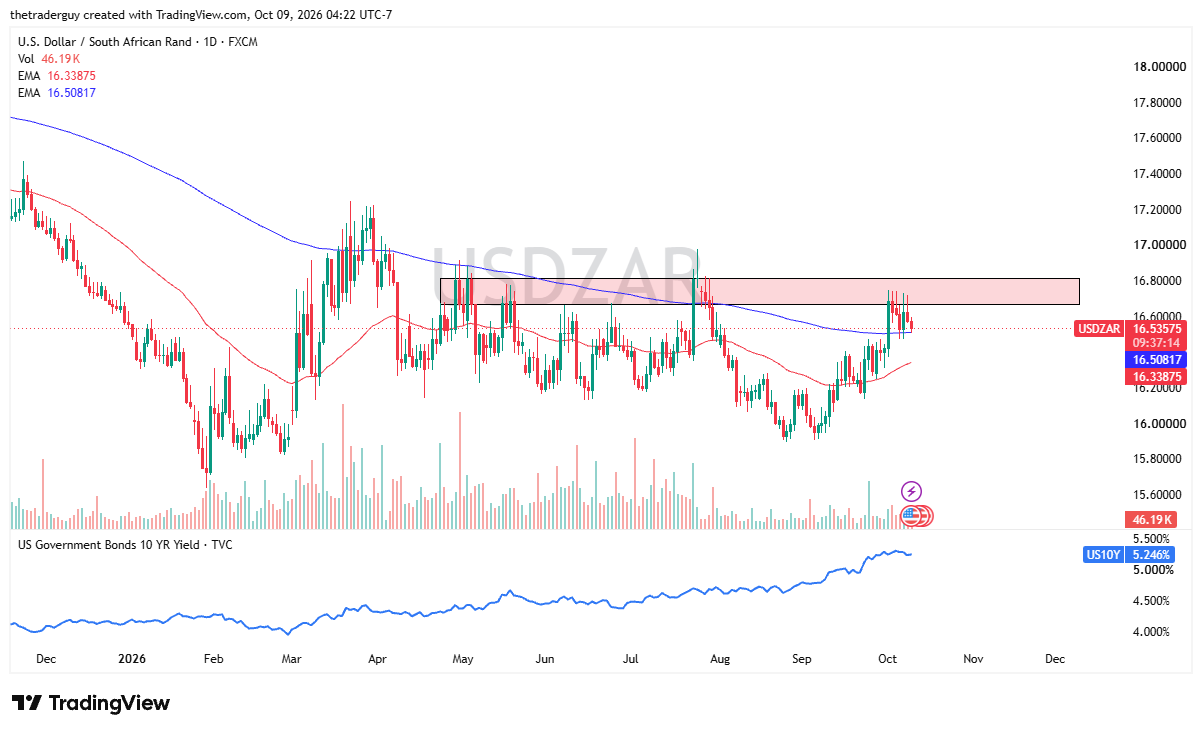
The U.S. dollar is drifting a little bit lower against the South African rand, and I’m watching to see if we can break down below the 16.48 level. If we do, and yields in America drift lower, I’m more than willing to get short here and collect the swap at the end of the day. A break above 16.80 would change the attitude.
Copper Technical Analysis
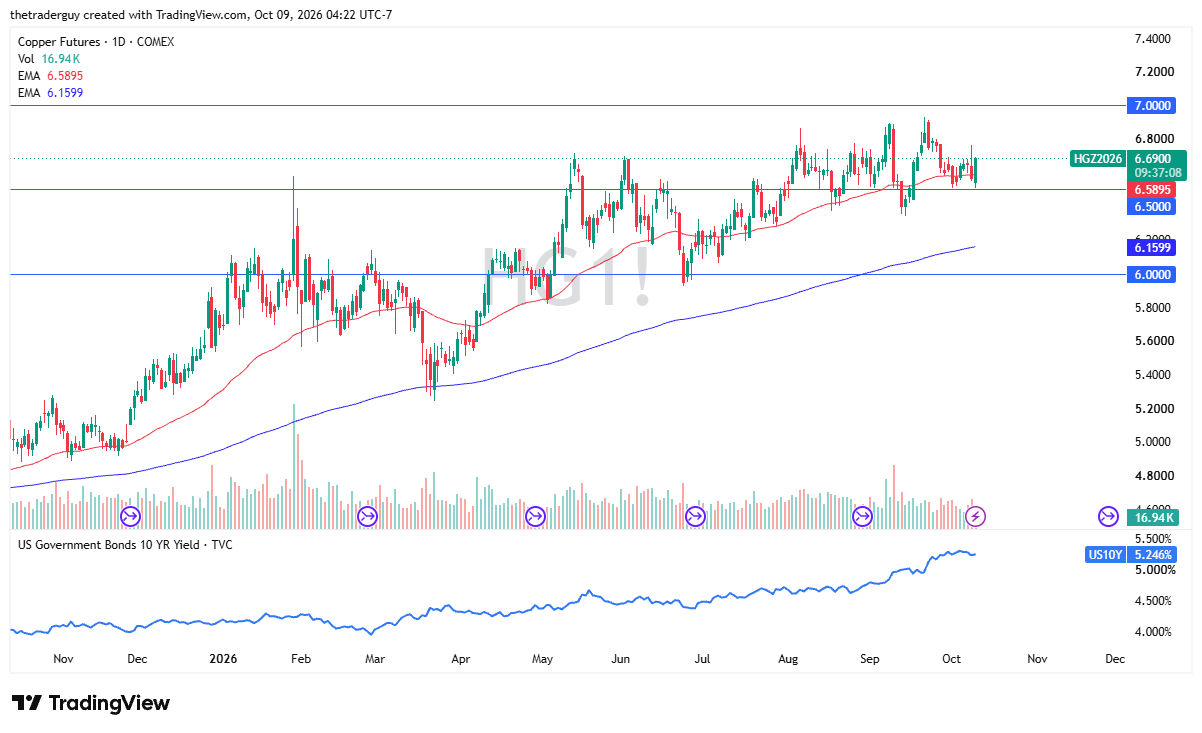
The copper market continues to look healthy. Short-term pullbacks continue to be buying opportunities in a market that has a world of demand out there and somewhat limited supply. Furthermore, we have to keep in mind that rates do work against non-yielding assets such as copper. So if they jump, that’s a little bit of an anchor around the neck.
Copper Price Forecast
Every new Copper analysis as it publishes, today's technical signal and key levels, live price — on one page.
See all Copper forecastsWe have seen copper stall recently as rates have gotten elevated, but the demand out there will eventually overwhelm, in my estimation. So I still like buying dips. I still think we have a lot further to go to the upside based on the demand and the fact that the supply really struggles to keep up with it from a consistent point of view.