


Solana (SOL) is still the best-performing token in the top 5 in the past 30 days with an 11% gain. However, it has retreated off the $80 level already as bearish market conditions continue to put a lid on crypto prices.
In the past 7 days, SOL has dropped by 7% after hitting a sell wall at $82. Net inflows to exchange-traded funds (ETFs) dried up last week, as these vehicles brought in only $1 million due to a strong $9 million outflow on July 8.
Oil prices rose to $80 as tensions in the Middle East persist. In addition, the market will be digesting today’s inflation data from the United States.
The annualized inflation rate is expected to decline to 3.8% in June, while the monthly variation is expected to be negative at -0.1%.
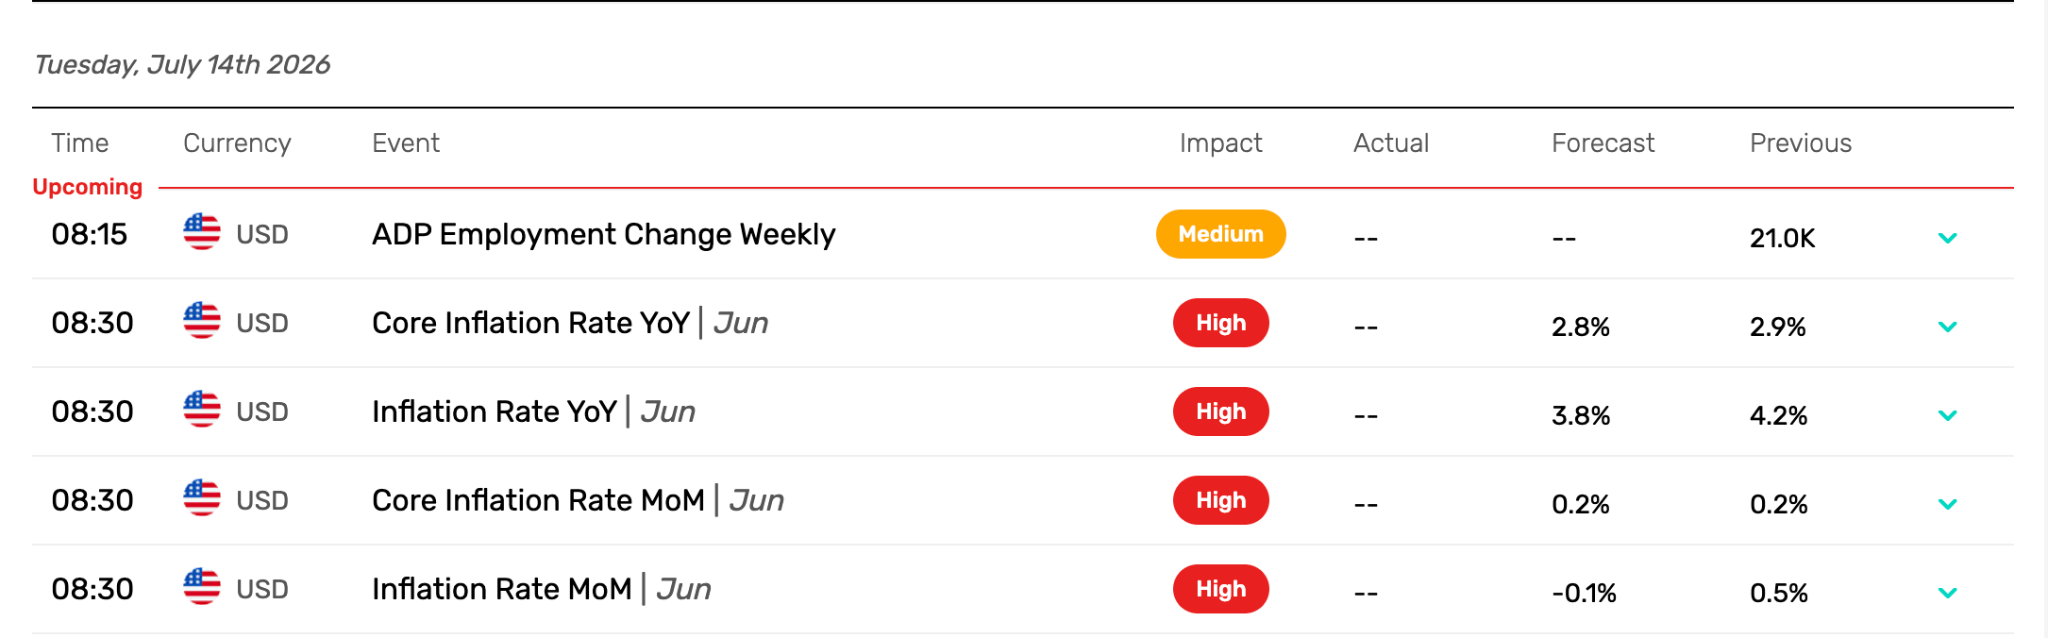
If inflation turned out to be higher than expected, that could plummet the markets once again, as it would further justify a hawkish stance from the Federal Reserve.
Altcoins are first in line to be battered in that scenario, as market participants tend to move out of risky assets when rates are increasing. In Solana’s case, this bear market has kept the token trading below $100 for months.

Solana’s DAUs Indicate That Investors Are Positioning for a Strong Price Move
Looking at on-chain data, we can see the strong impact that these challenging conditions have had on the blockchain’s ecosystem growth.
Weekly application fees just closed last week at their lowest level since 2023 once again. At $5.8 million, applications collected 88% less compared to this year’s peak of $50 million in early February and 98.5% less than their weekly all-time high of $491 million back in January 2025.
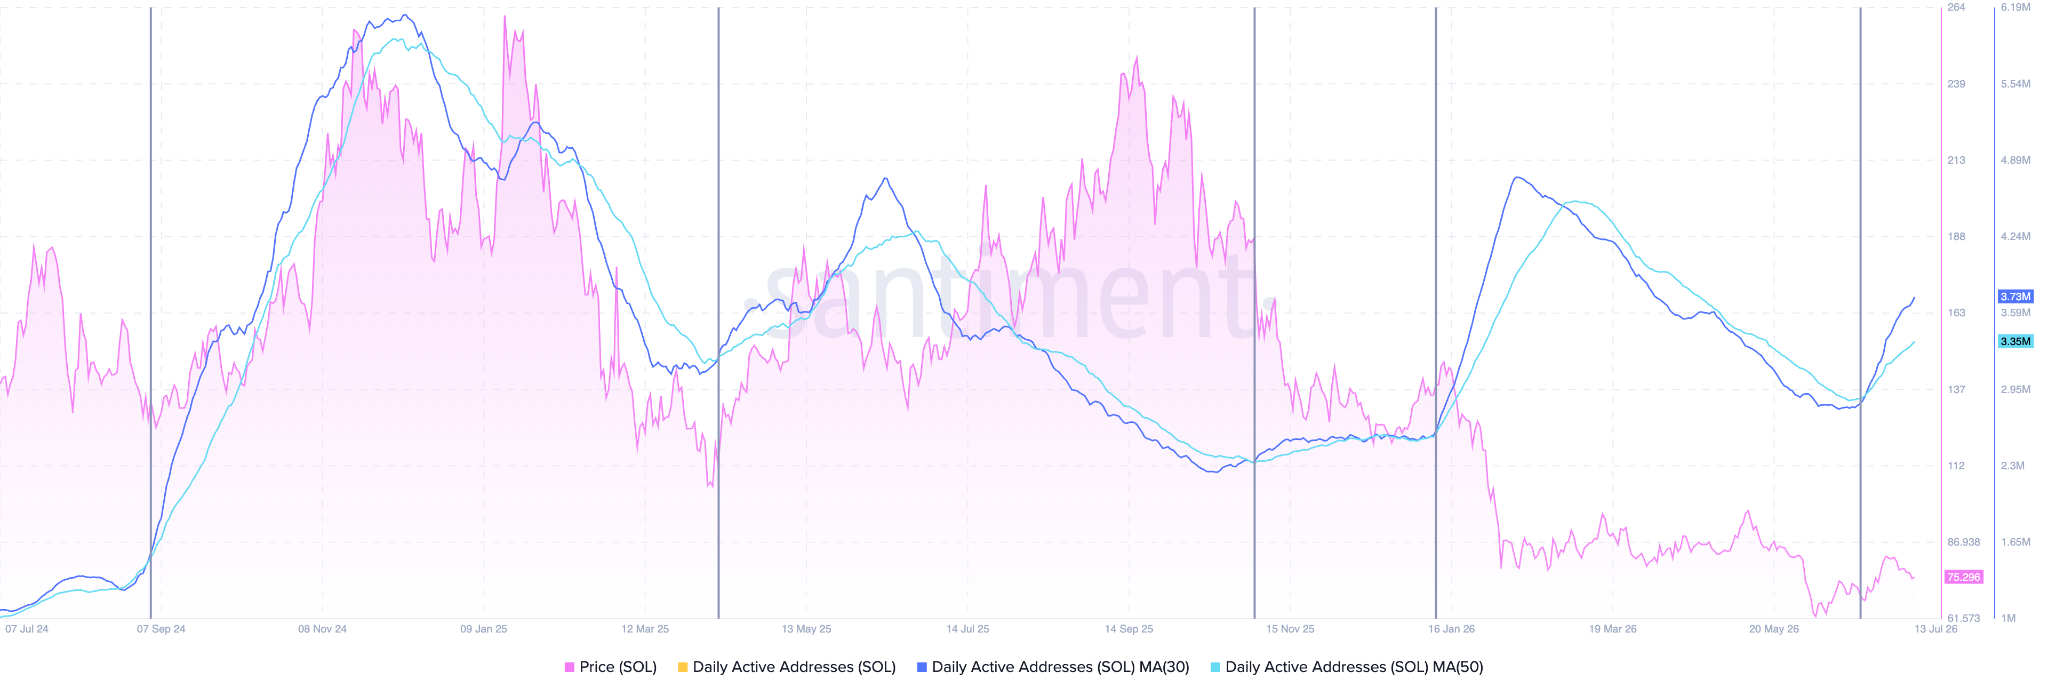
Meanwhile, the network’s daily active users (DAUs) have been rising lately. Data from Santiment shows that the 30-day moving average for this particular metric just crossed above the 50-day moving average.
What this indicates is a short-term spike in the number of active wallets within the blockchain. In previous instances when this crossover has happened, the price has made a big move.
For example, the last time the two lines crossed, SOL dropped from $140 to $92. The time before that, the price actually rallied from $112 to $184.
The reason why this is a two-way street is that a higher number of active wallets signals that market participants are positioning for the next big trend — which could be either an uptrend or a downtrend.
Solana Price Forecast
Every new Solana analysis as it publishes, today's technical signal and key levels, live price — on one page.
See all Solana forecastsSOL Could Rise to $90 If It Manages to Stay Within Its Price Channel
Heading to the daily chart, we can see that SOL has formed an ascending price channel pattern over the next few weeks.
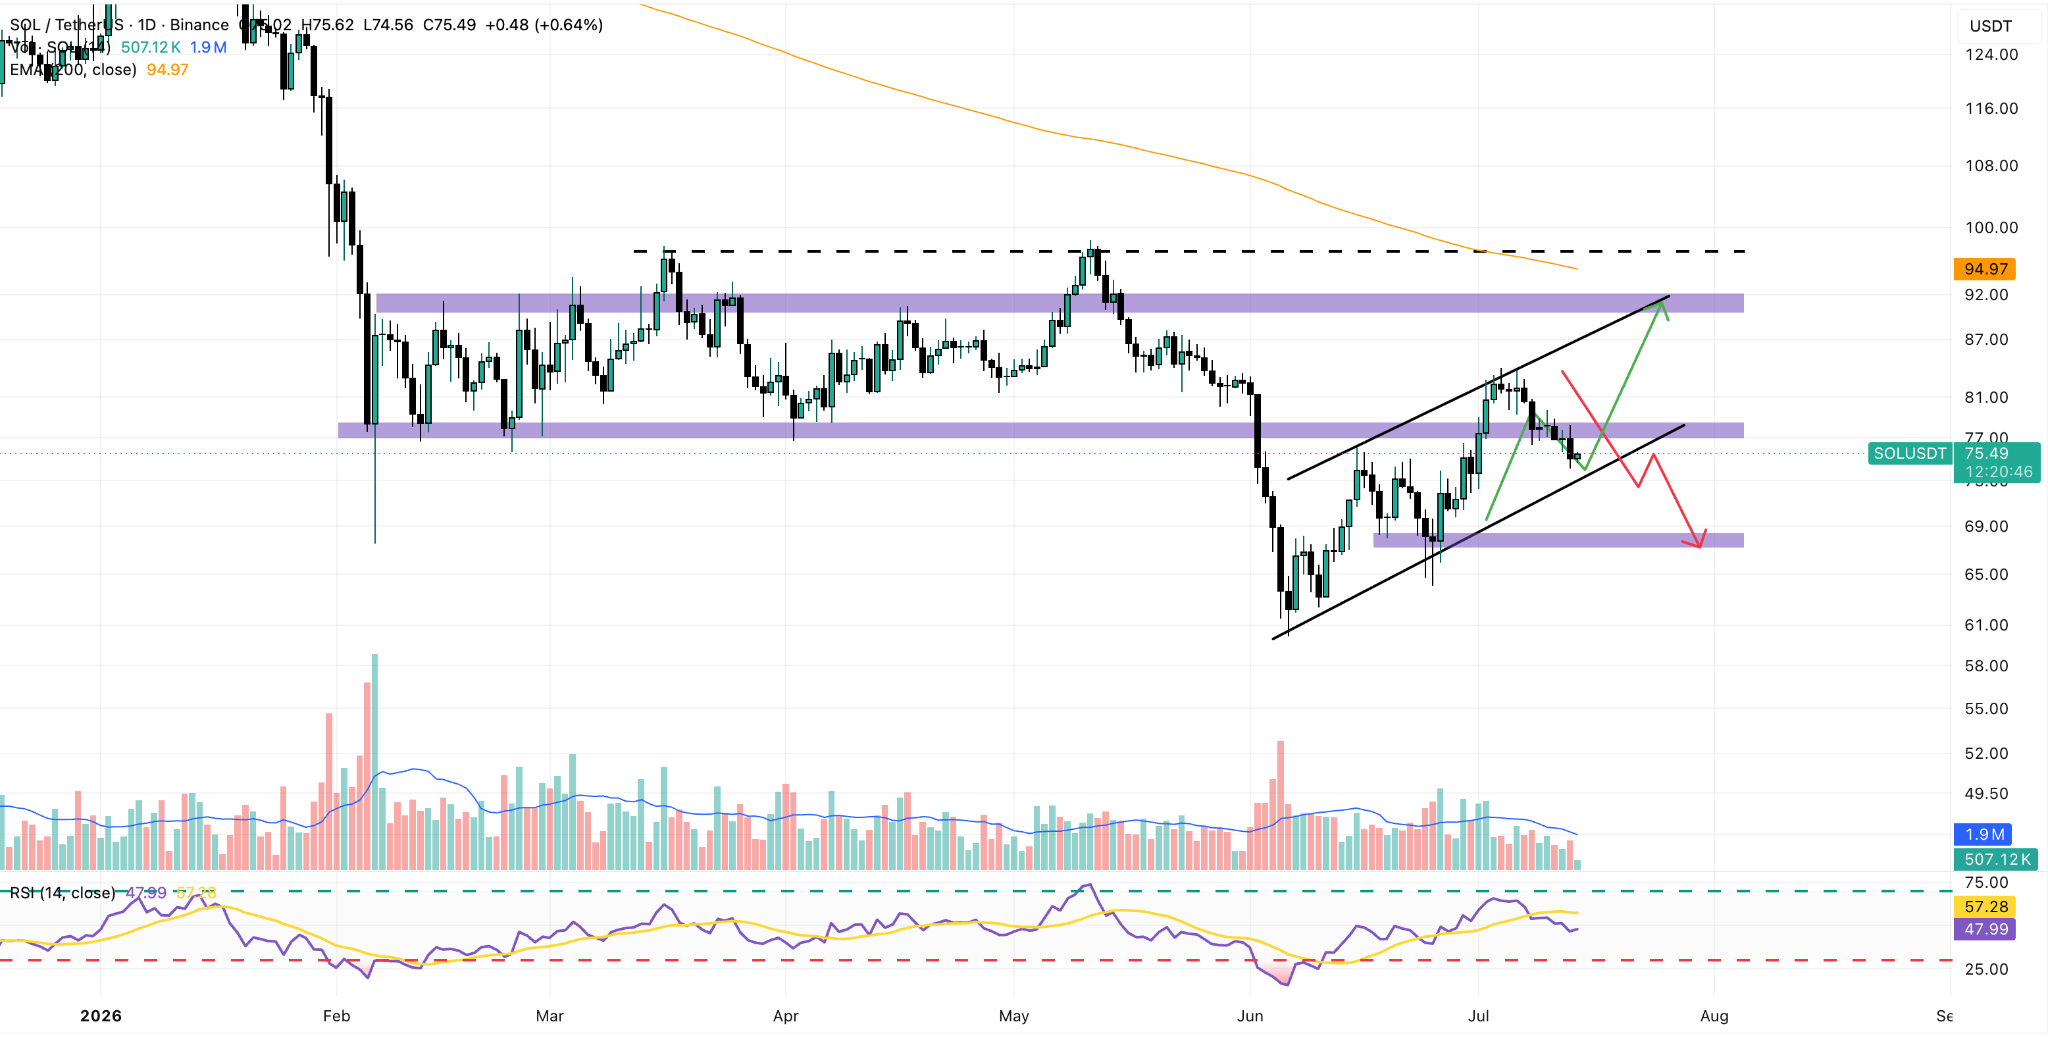
This is a bullish pattern as long as the price stays above the trend line support. That makes the $73 level our key area to watch at the time.
If the token breaks this demand zone, the next stop will likely be $68, meaning an 11% downside risk. On the other hand, if the price action bounces off this mark, that could mean that the price is heading to retest the $90 area once again.


