Hyperliquid’s HYPE token has reached a critical technical support area after retreating from its June highs, with a classic bullish setup pointing to a potential 50% rebound next.

HYPE Price Could Rebound Toward $95
As of Tuesday, July 14, HYPE was trading near $63.80, testing the lower trendline of its prevailing symmetrical triangle. The support coincides with its 50-day exponential moving average (50-day EMA, the red wave) near $63.15, strengthening the possibility of a price recovery.
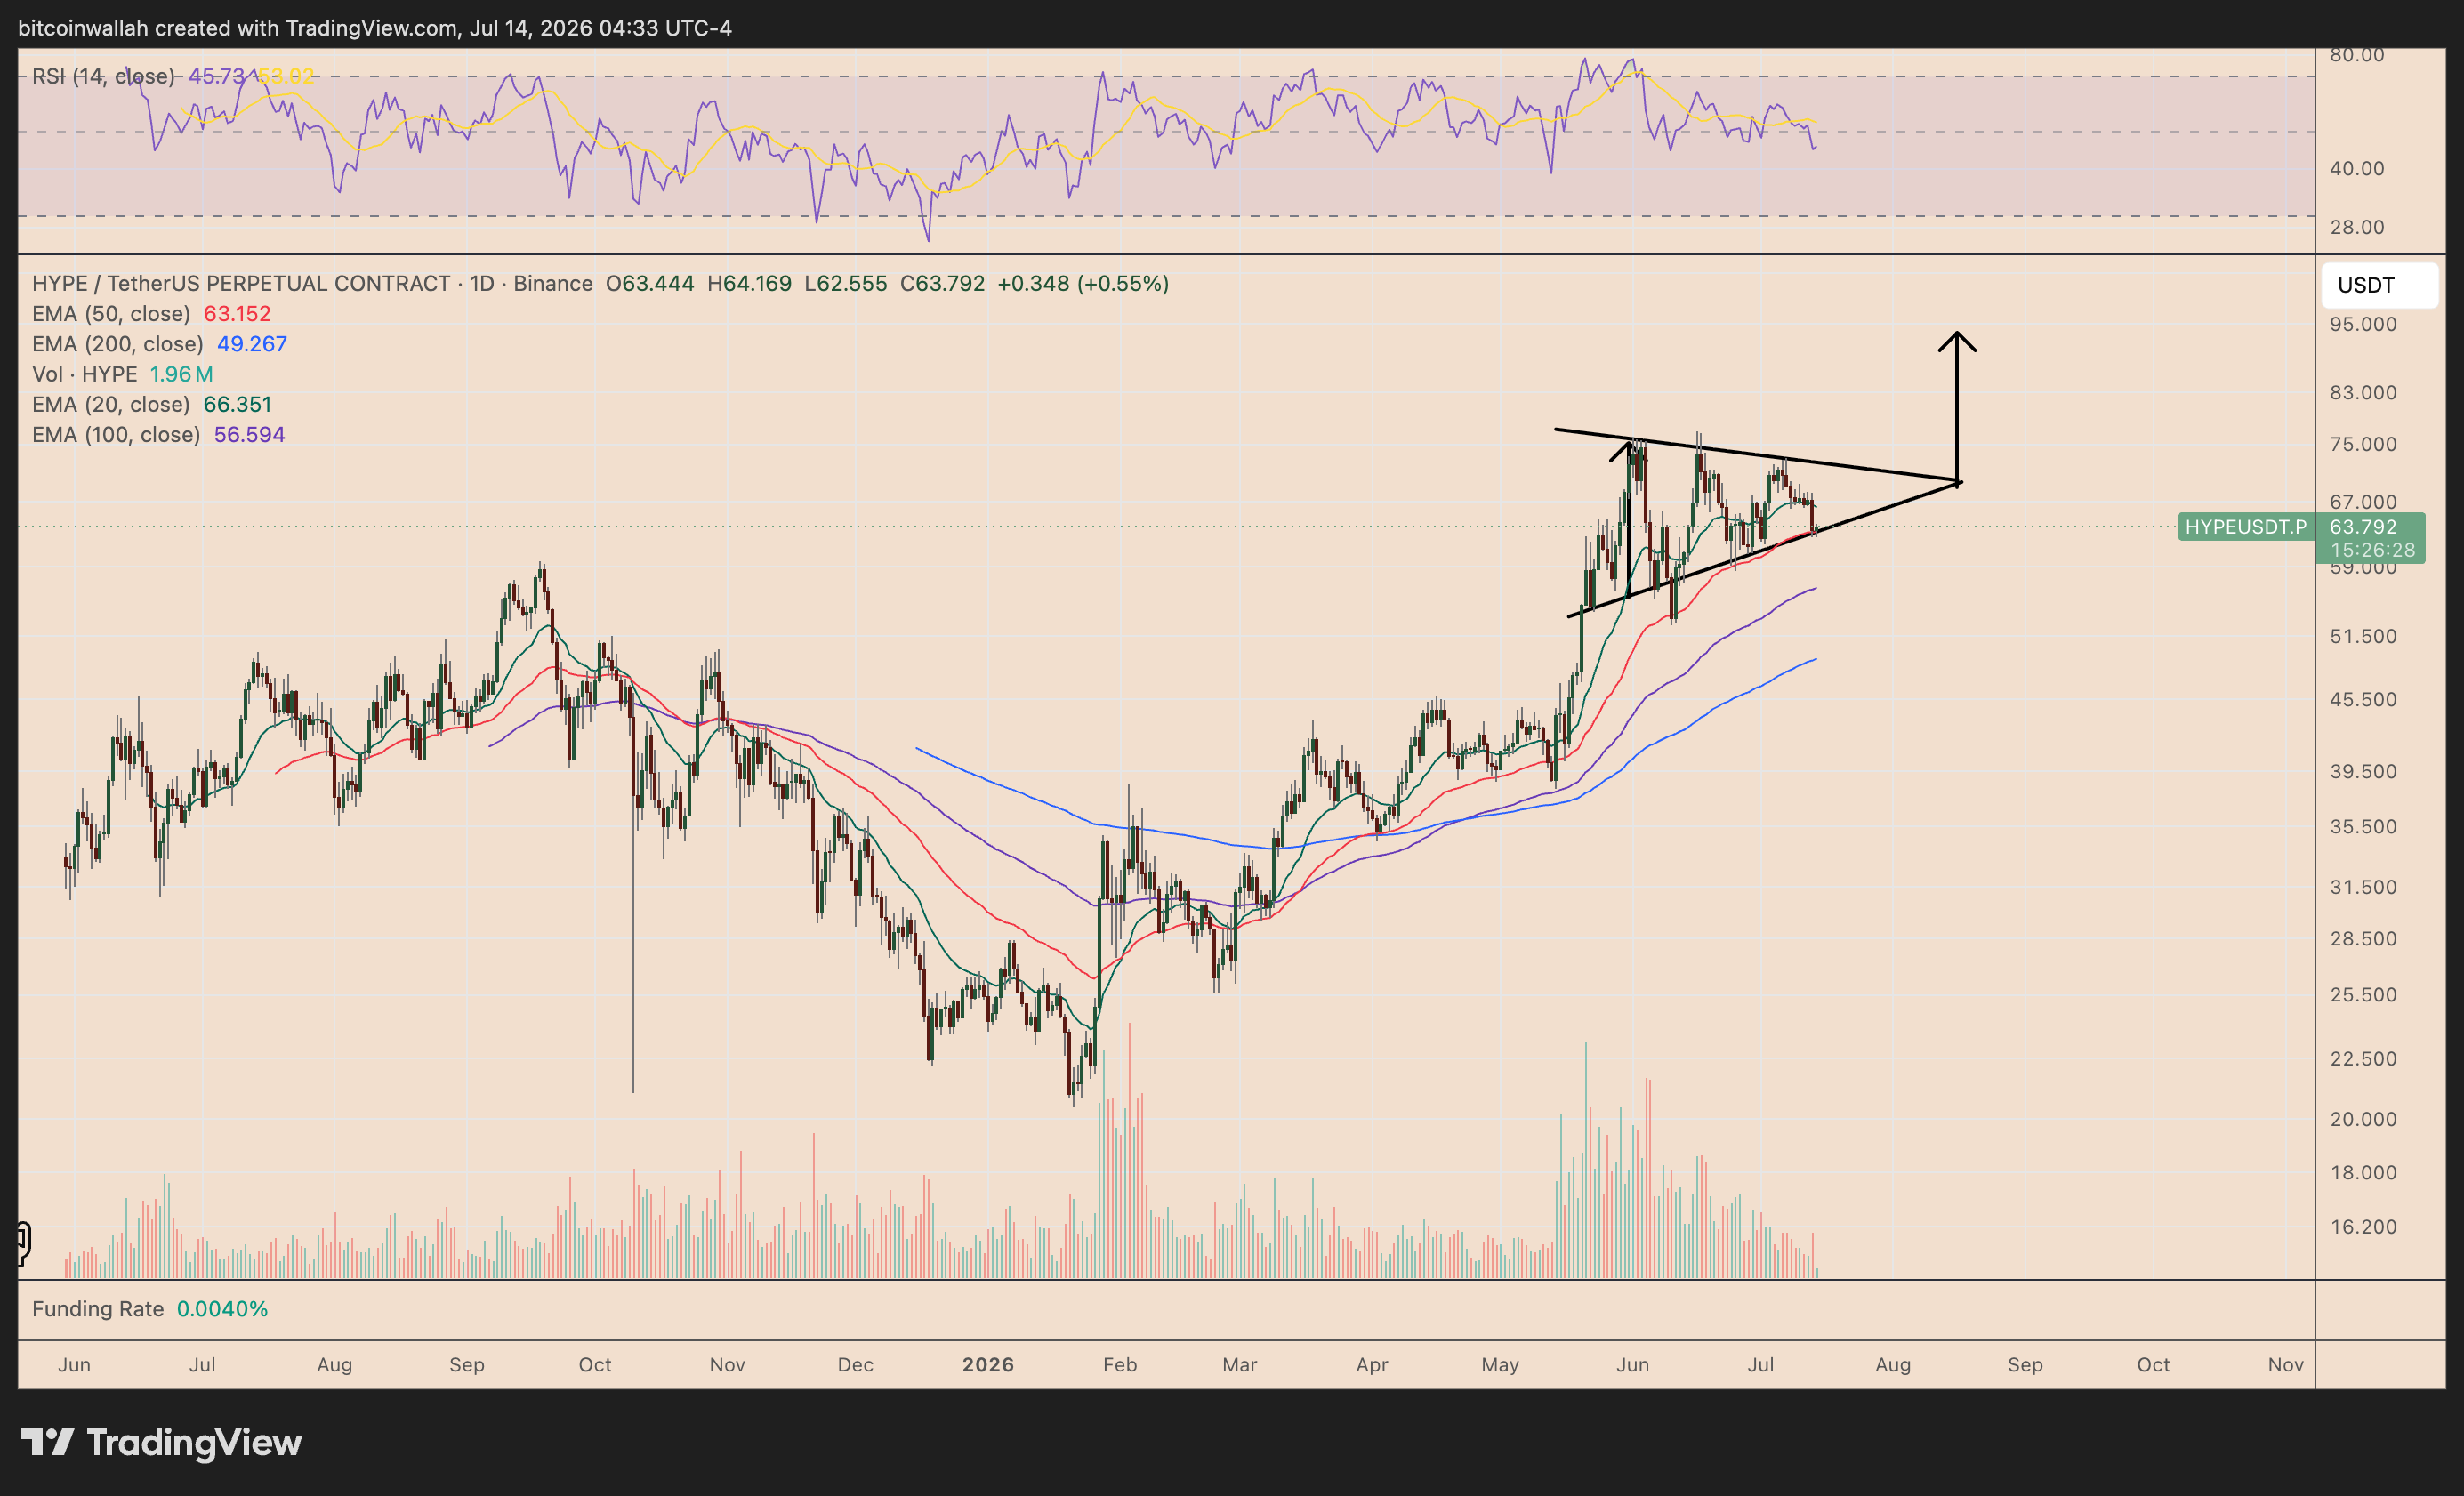
A symmetrical triangle forms when price consolidates between converging resistance and support trendlines. HYPE entered the structure after rallying sharply during May and June, giving the pattern a bullish continuation bias.
Holding the $62–$63 support area could enable HYPE to rebound toward the triangle’s falling resistance near $69–$70.
A decisive daily close above that resistance would confirm a breakout. Adding the triangle’s maximum height to the potential breakout point produces a target near $93–$95, approximately 50% above the current price.
HYPE Breakdown Could Trigger a 20% Drop
Symmetrical triangles can produce bearish reversals despite forming after strong rallies.
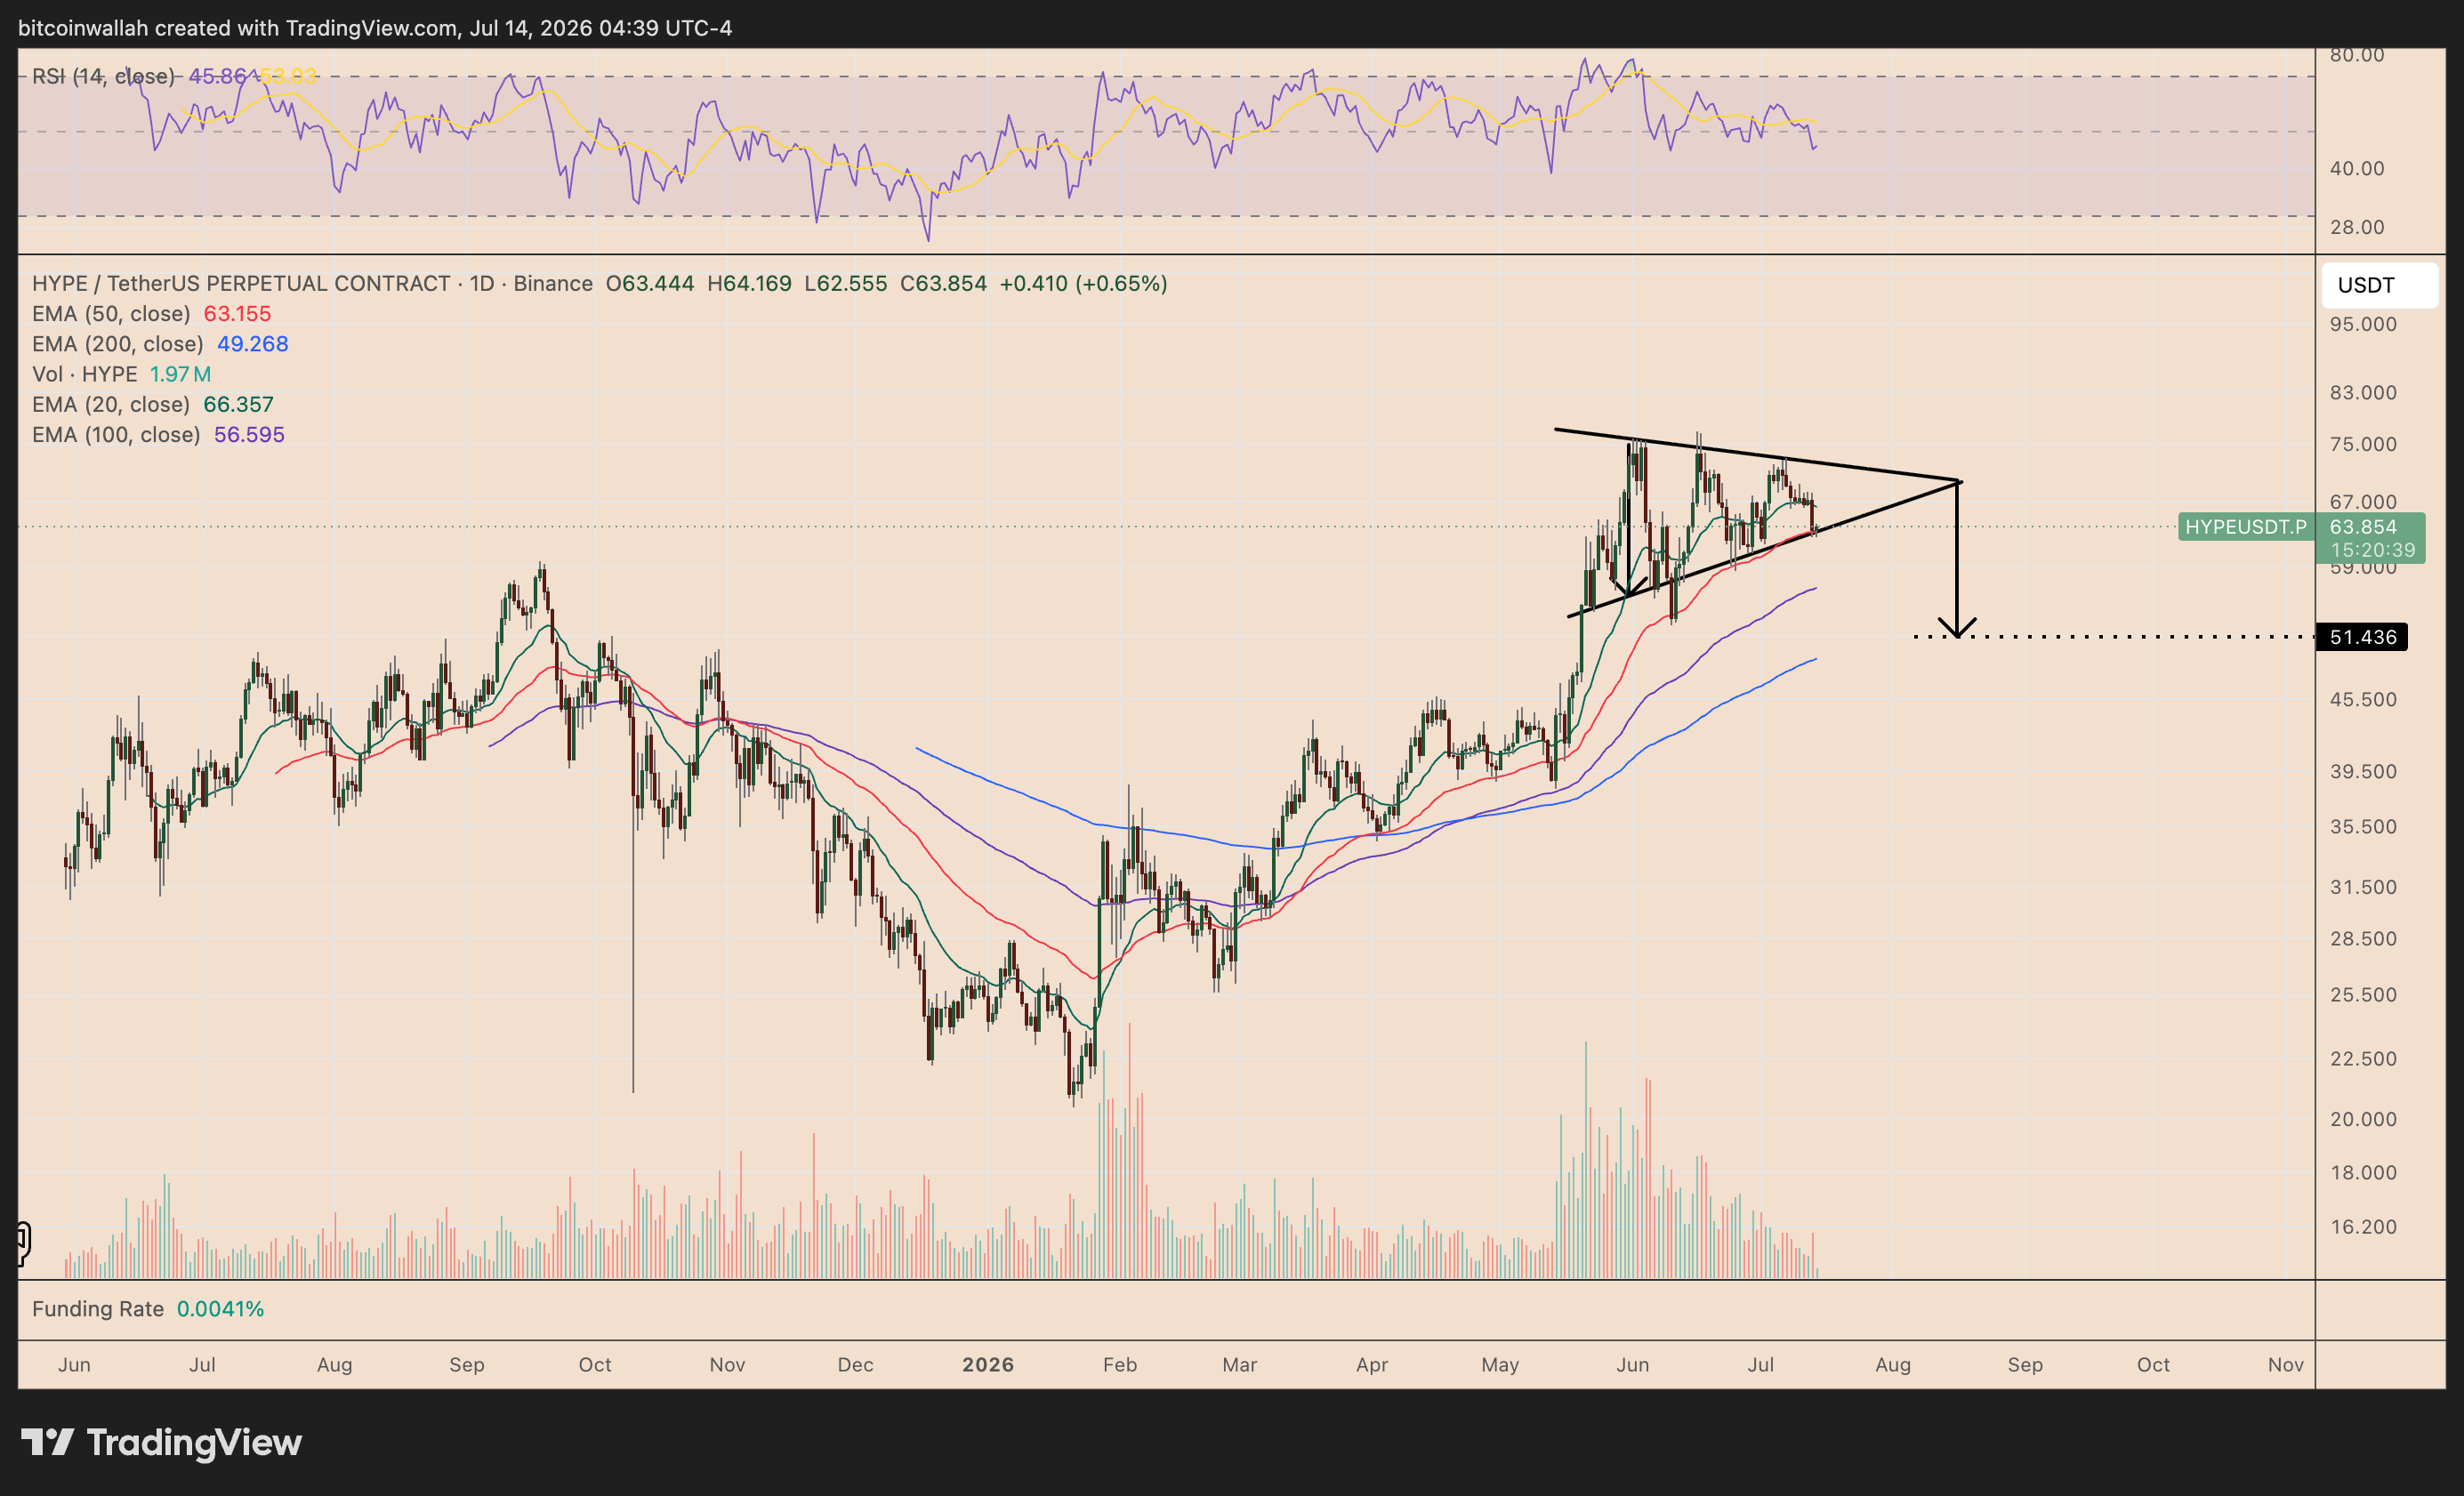
A decisive daily close below HYPE’s rising trendline and 50-day EMA near $62–$63 could confirm such a reversal.
The triangle’s measured move projects a downside target near $51.40, about 20% below current prices. The 100-day EMA (purple) near $56.60 may act as interim support.
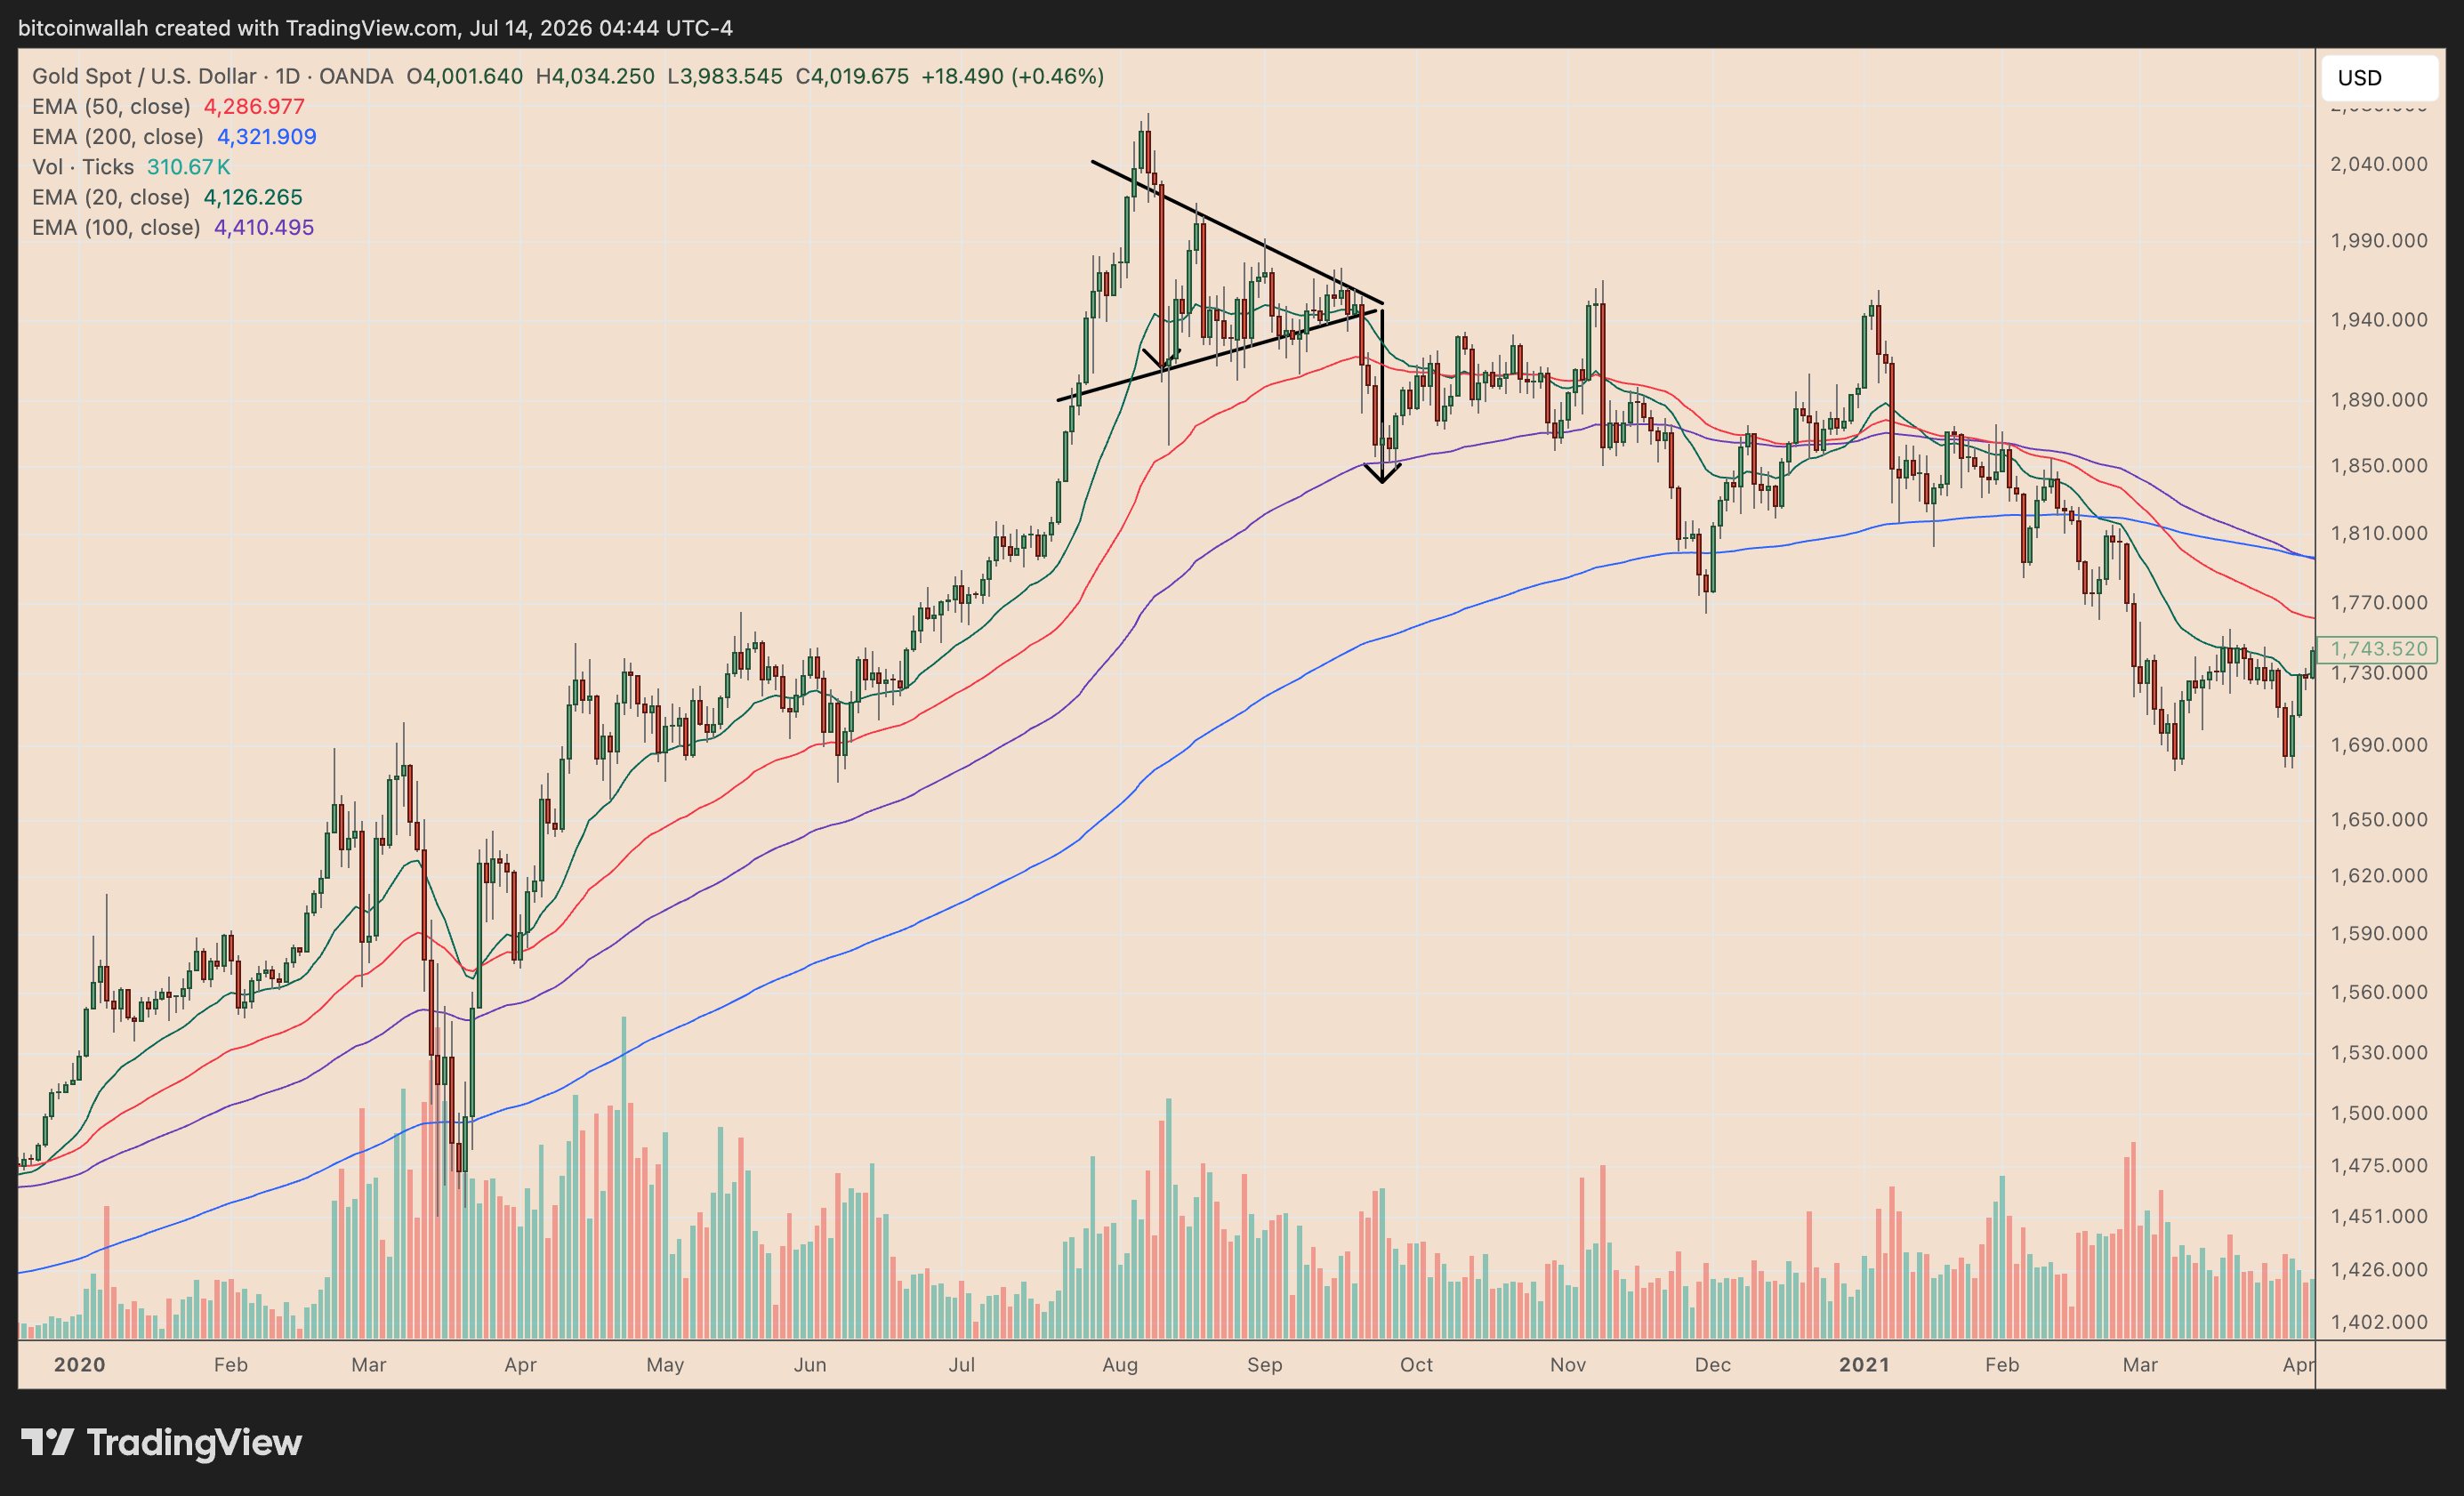
For HYPE, rising volume during a breakdown would strengthen the bearish signal. Conversely, holding the $62–$63 area would keep the rebound scenario intact.