
Dollar, Euro and Pound Navigate Policy Signals and Data Releases
The dollar continues to find support due to Federal Reserve rhetoric emphasizing a hawkish response to inflation and the prospect of higher rates staying in place for longer. Attention is focused today on US CPI inflation readings and Fed Chairman Kevin Warsh’s appearance before Congress for insights on the direction of US monetary policy in the face of sticky inflation. Warsh’s hawkish lean has reinforced the dollar’s appeal relative to peers.
Meanwhile, the euro is underperforming as markets begin to anticipate that the European Central Bank’s rate hike cycle has been concluded. The euro remains pressured by weaker economic growth in the eurozone as the ECB continues to make data-dependent decisions and maintain its cautious approach toward further tightening of policy.
The British pound has been trading within a range with the Bank of England expected to maintain tighter monetary policy as inflation remains a key concern and with UK economic data also a focus. Sterling’s trajectory will continue to be affected by developments across Britain including growth data and inflation readings. The dollar and euro also play key roles in this equation.
Market participants will be seeking new data and commentary today for further guidance on policy and growth outlooks as these factors will remain influential in setting the tone for the near-term trajectory of the G10 currencies.

DXY Holds $101.20 – Fib 0.618 Retest on 1D
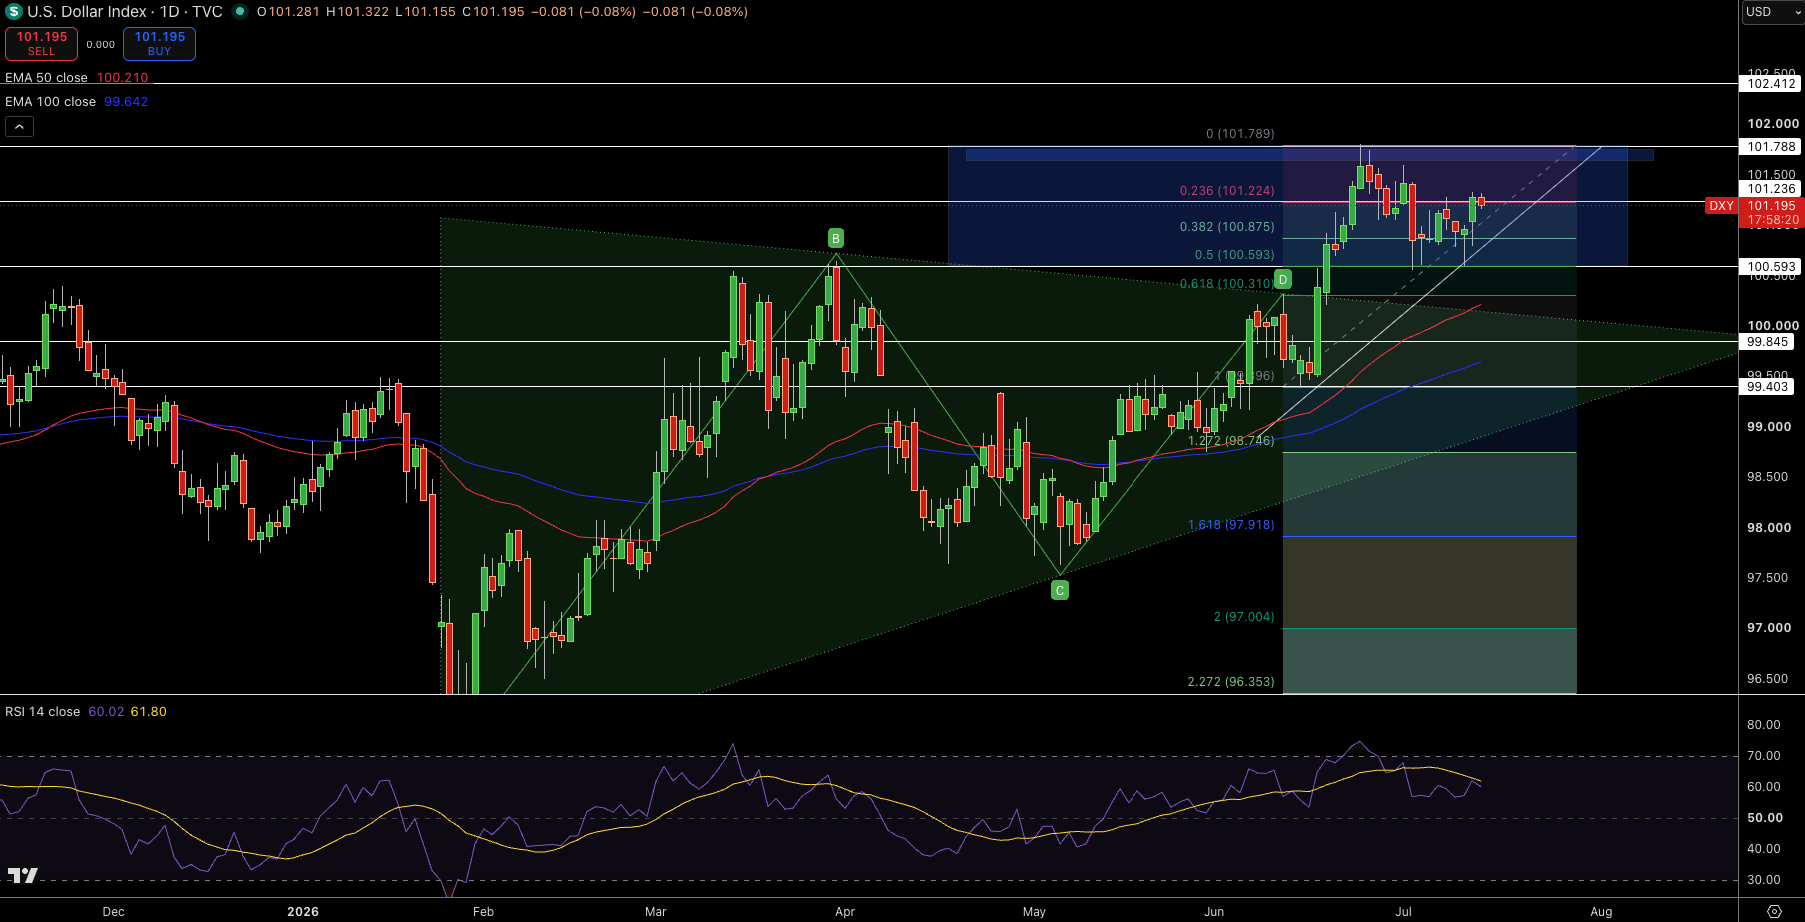
DXY holds $101.20, with the daily chart showing mixed candlestick retesting of the Fibonacci 0.618 level at $100.31 after a strong breakout from the $97.67 swing low. Bullish candles are making higher highs with the price staying above the 50-period EMA at $100.21, signaling buyers’ control.
The RSI, though still near neutral at 60, is biased to the upside. The volume profile is also showing $101.00 to 101.50 as the breakout zone. In the coming weeks, the technical analysis suggests a target near $103.09.
Since the price is holding above $100.31, the technical structure remains strongly bullish. As the chart is in an uptrend, the price is making higher highs and higher lows in a channel. My plan is to buy above $101.20 targeting $103.09, with a stop loss at $100.31.
EUR/USD Price Forecast
Every new EUR/USD analysis as it publishes, today's technical signal and key levels, live price — on one page.
See all EUR/USD forecastsGBP/USD Holds $1.3361 – EMA 50 Defense on 4h
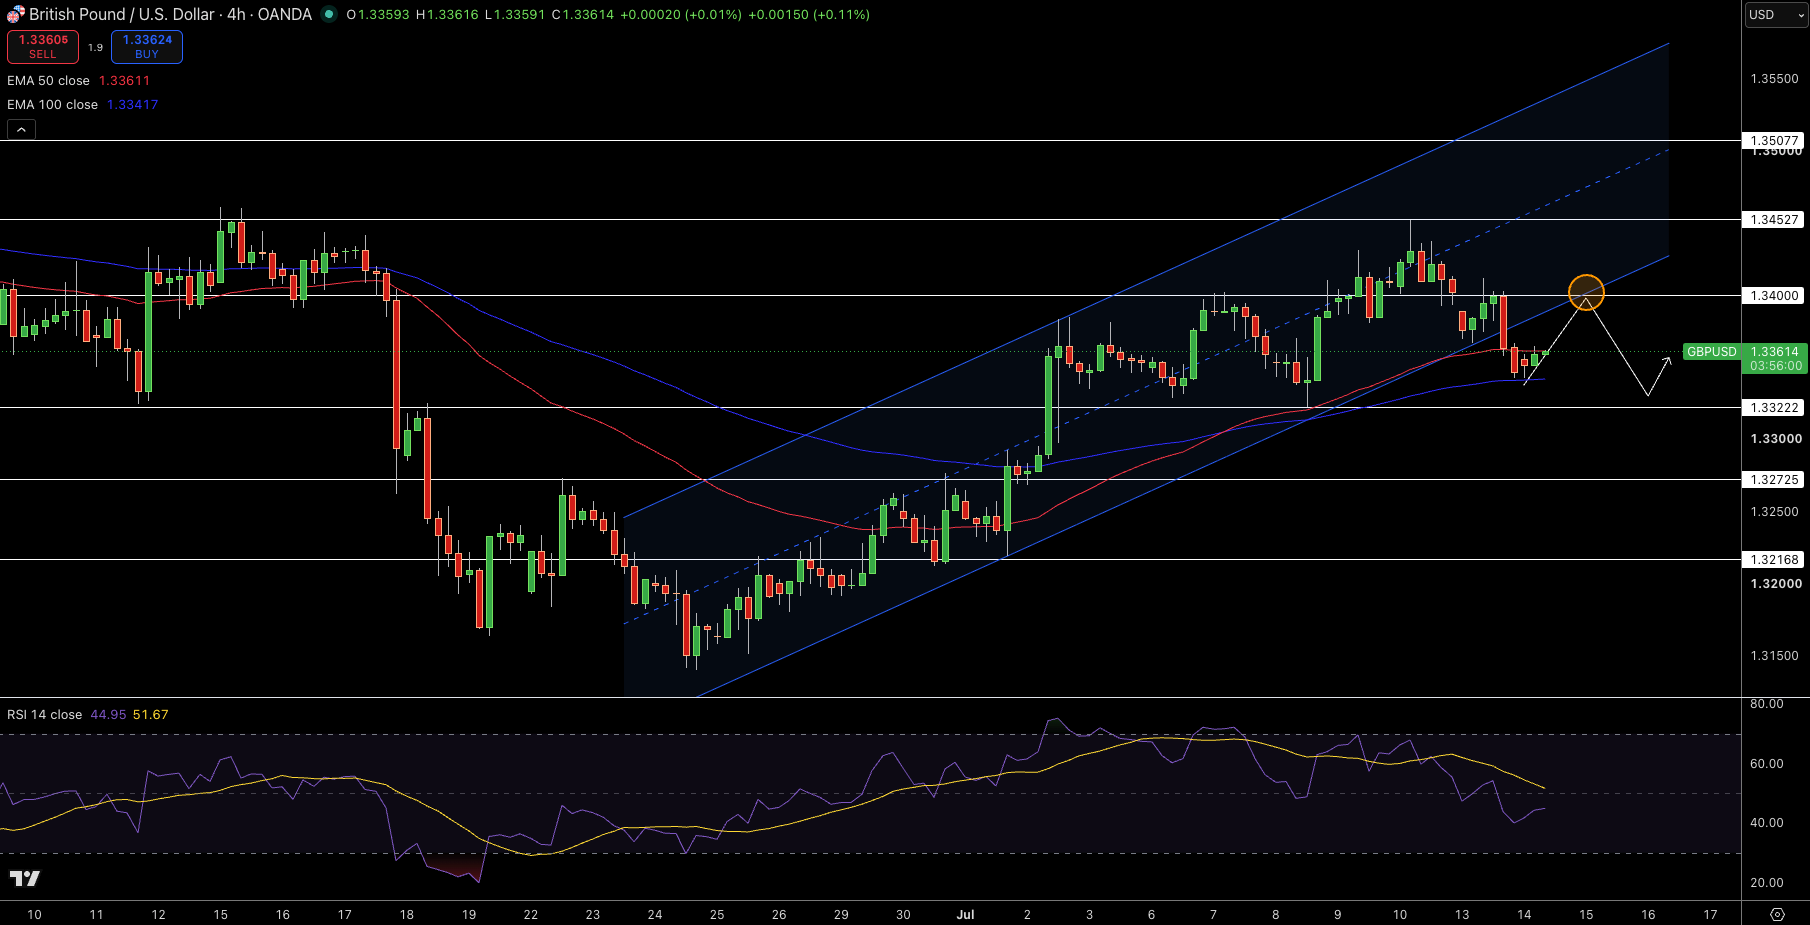
GBPUSD at 1.3361 on the 4-hour chart, testing the 50 EMA at 1.3361 after a corrective wave from 1.337 zone. The mixed candlestick pattern shows higher lows with a bullish lower wick confirming buy intervention at this level. RSI stands at 45, and is still at neutral levels and room to grow. The volume profile shows 1.331 to 1.338 are in the current consolidation zone. The next immediate resistance is 1.345 to 1.350.
Above the 50 EMA at 1.3361 the bias is neutral-to-bullish within a larger range and higher lows suggest an upward movement continues as price pulls back towards 1.3361. I will be looking to go long on Sterling over 1.3361 targeting 1.345 with a stop at 1.325.
EUR/USD Holds $1.1393 – EMA 50 Defense on 4h
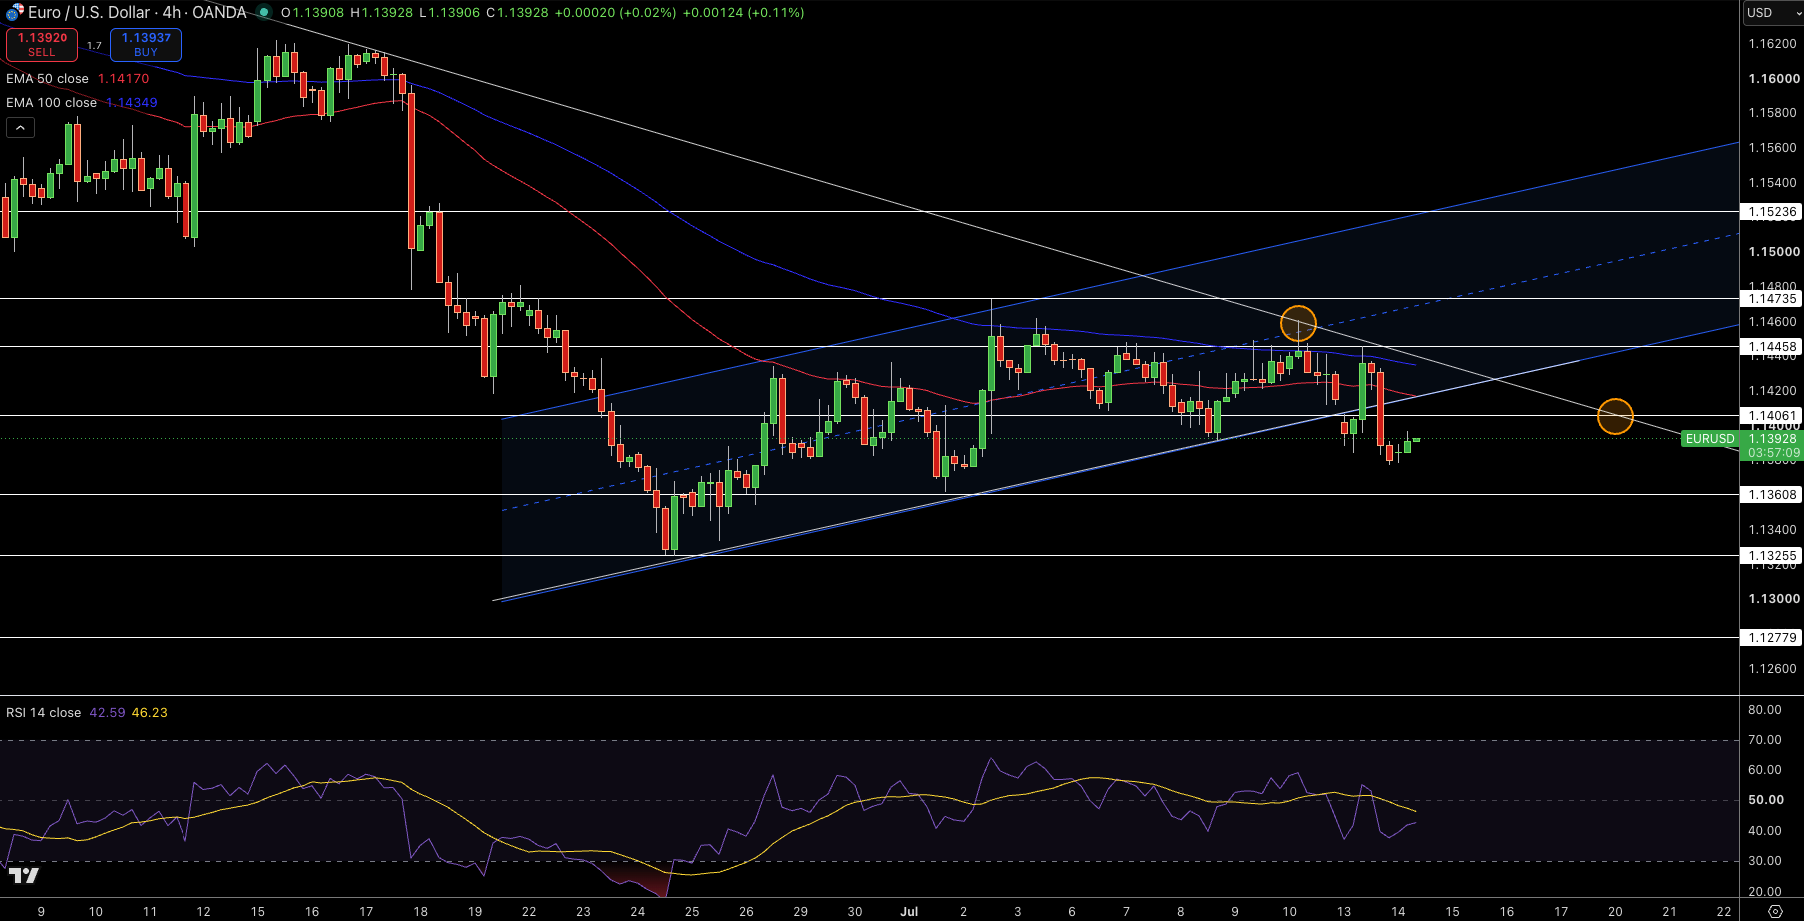
EURUSD at $1.1393 on the 4-hour chart, bouncing off the 50-period EMA at $1.1417 after a corrective wave from the $1.162 zone. The mixed candlestick pattern showed higher lows with a bullish lower wick confirming the buy intervention at this level. The RSI stands at 43, and is still at neutral levels and room to grow. Based on the volume profile, $1.140 to 1.150 are in the current trading zone. The next immediate resistance is $1.155 to 1.162.
Above the 50 EMA at 1.1417 the technical bias is neutral-to-bullish in a larger downtrend and higher lows suggest an upward movement continues. I will be looking to go long over 1.1393 targeting 1.155 with a stop at 1.140.