
Oil Markets Adjust to Supply Normalization as Geopolitical Premium Fades
Market sentiment in oil recently has been more of a recovery. After the interim deal reached between the US and Iran and the subsequent reopening of the Strait of Hormuz, Iranian crude oil exports started to gradually return. While Iran oil trade and exports have yet to fully recover to pre-Hormuz Strait blockade levels, crude tanker movement has gradually returned to normal. As such, the market has returned to a more typical supply and demand imbalance.
In recent weeks, the voluntary production cuts announced by OPEC+ have been scaled back. As part of those reductions, core OPEC+ members have announced further quota increases for both July and August. Oil prices have been generally positive on compliance data showing OPEC+ members continue to honor their production quotas. But as Iranian oil exports gradually return to the market, actual inventory data and oil prices will have more sway. Also, US oil production continues to stay at record levels while additional supplies come from Brazil, Guyana and Canada.
While crude demand growth remains steady, led by demand growth in Asia, overall demand for transportation fuels and petrochemicals remains relatively flat. The International Energy Agency (IEA) and OPEC expect steady growth throughout the rest of 2026. However, gains may be dampened by increased efficiency as well as higher borrowing costs for many emerging markets.
Natural gas prices are also influenced by the same forces affecting natural gas futures prices, including seasonal demand factors, global LNG shipments and regional gas storage levels. In particular, prices are affected by the supply and demand outlook at the Henry Hub.
Other factors also include broader macroeconomic sentiment, which continues to play a role in oil prices. Persistent US inflation continues to weigh on the Federal Reserve to maintain its interest rates at the current level. The dollar remains a major factor in oil price movements as well as bond yields. Oil and commodity prices will be heavily influenced by upcoming weekly EIA and API reports, any future OPEC+ announcements, and the next batch of US economic data reports.
Natural Gas Futures Hold $2.888 – EMA 50 Defense on 4h
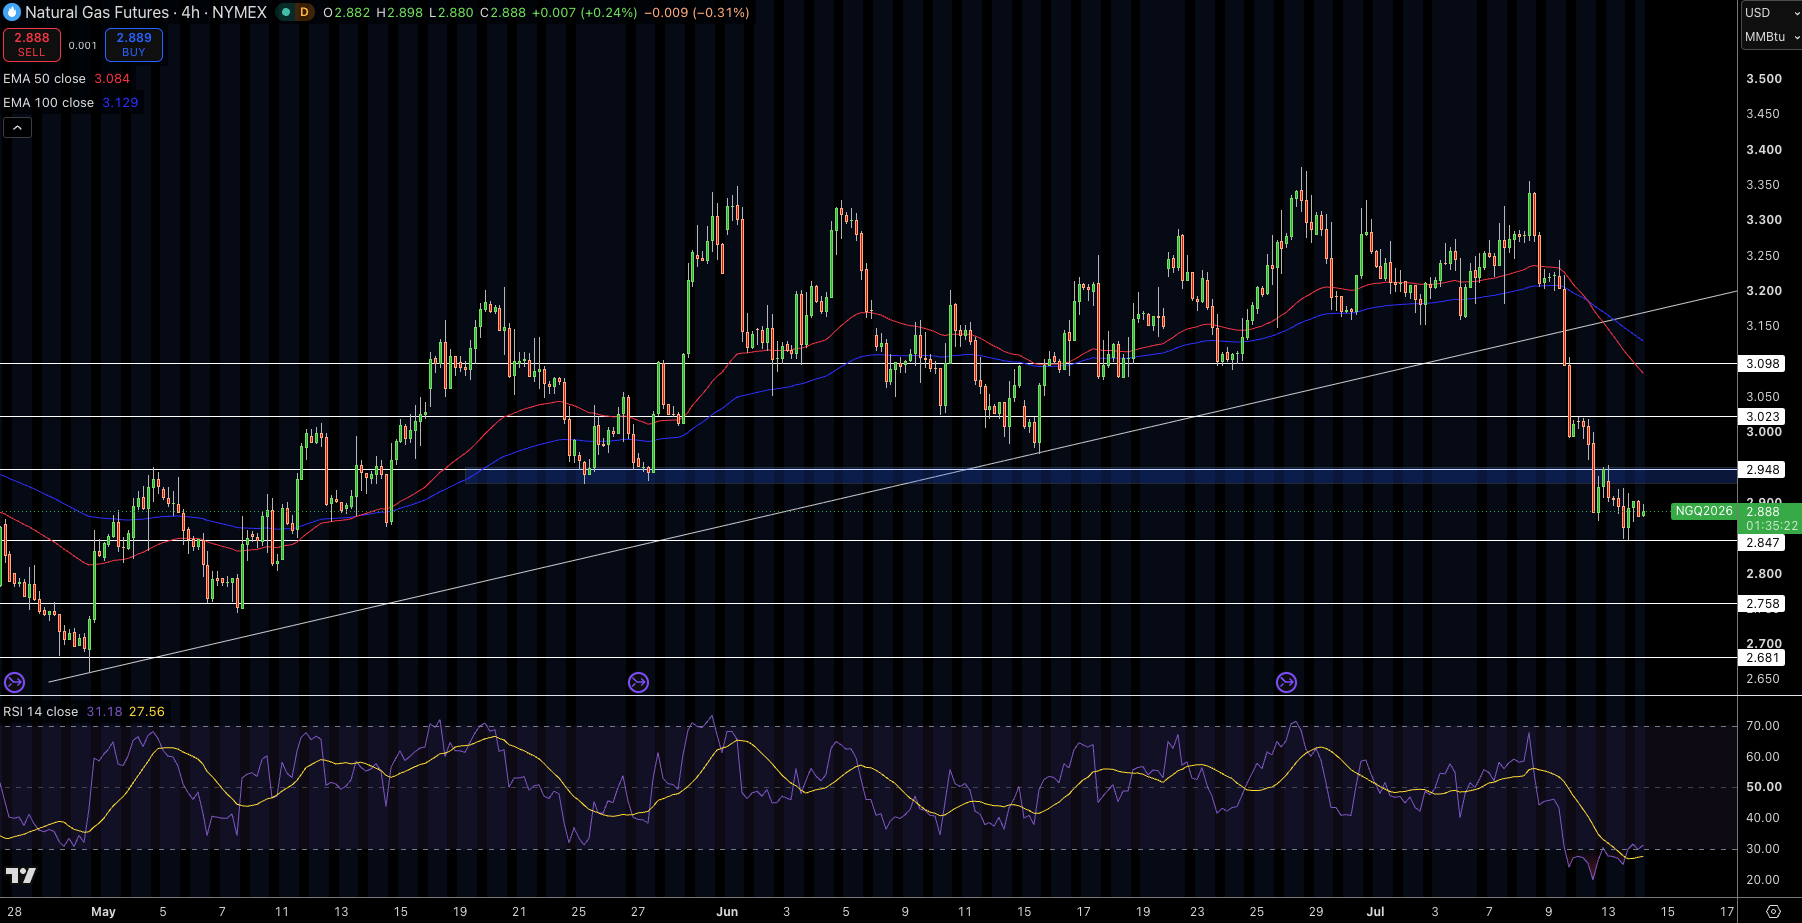
Natural gas futures are trading at $2.888 on the NYMEX exchange after being turned away from the 100 EMA ($3.129) and holding support off the 50 EMA ($3.084). Alternating candles are indicative that sellers are running out of steam and letting buyers take over, with swing lows at $2.758 printing rejection wicks, so buyers are catching it off any dip.
RSI is now at 31 which shows that it is heading towards oversold territory. Volume Profile has pivots at $2.97, which are acting as support. Fibonacci Extension on the low to high move from $2.758 indicates I should be watching $3.023 to $3.199 next.
The chart structure is neutral above $2.758 and the EMA cluster with higher lows drawing buyers into the market so I would be looking to go long at $2.888 with a take profit at $3.023 and a stop below $2.758.
Natural Gas Price Forecast
Every new Natural Gas analysis as it publishes, today's technical signal and key levels, live price — on one page.
See all Natural Gas forecastsWTI Crude Oil Rises to $79.57 – Fibonacci 0.618 Retest on 4h
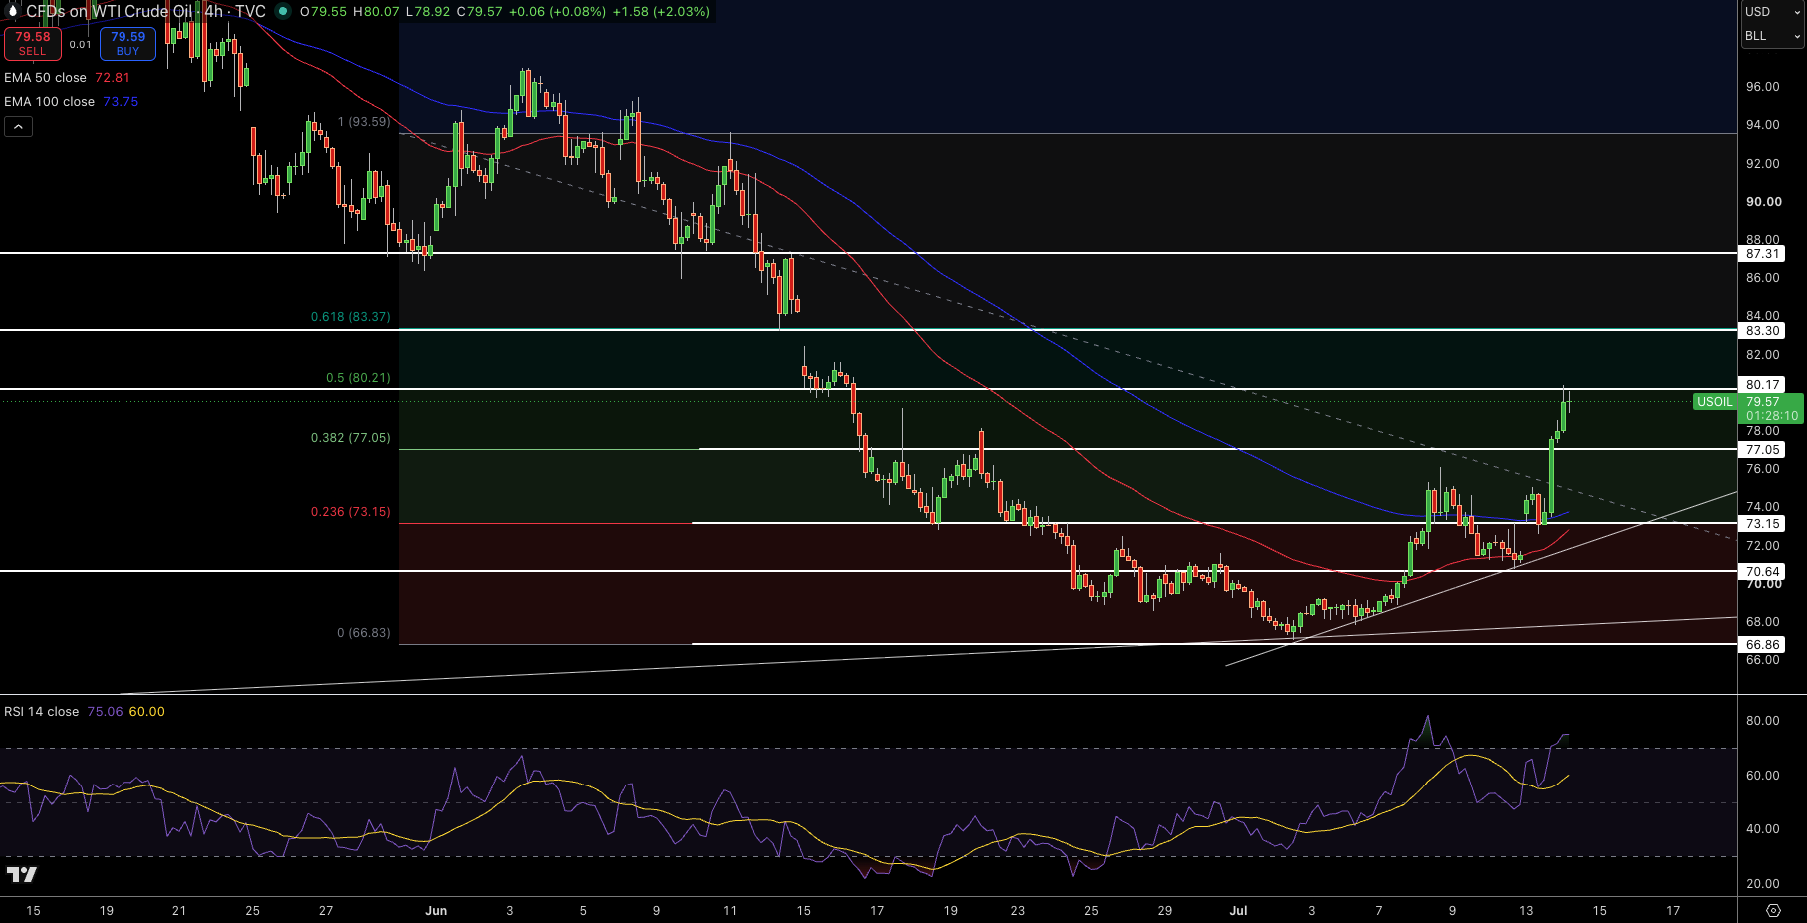
WTI is trading at $79.57. Since bouncing off the low of the swing at $66.83, alternating green and red candles have probed the 0.618 Fibonacci level at $83.37. Buyers are leading, backed up by bullish candles printing higher highs, while price is holding the blue 100 EMA ($73.75). The RSI has reached 75 indicating that it is in overbought territory, while Volume Profile has a pivot at $77.05 to $80.21.
Above $77.16, in the downtrend off the high at $110, the structure is neutral to bullish with higher lows drawing buyers into the market on pullbacks, so I would be looking to go long at $79.57 with a take profit at $83.37 and a stop below $77.16.
Brent Crude Oil Rises to $84.76 – EMA 50 Defense on 4h
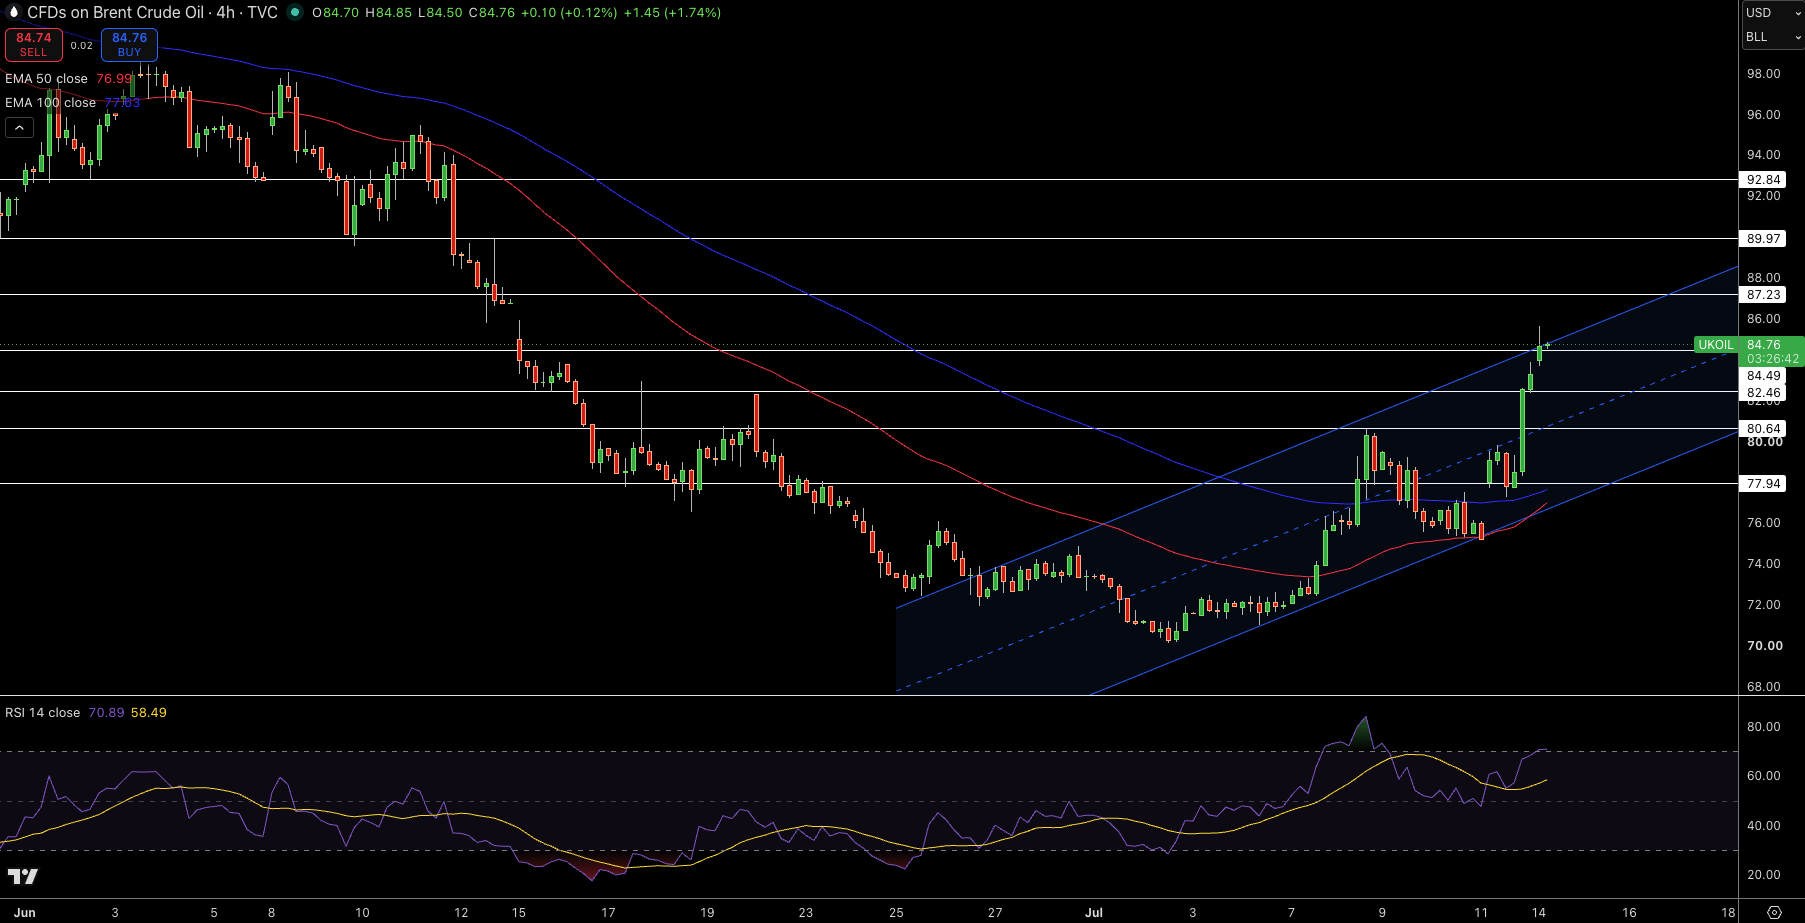
Brent Crude is trading at $84.76 after bouncing off the 50 EMA ($76.99) following an initial rejection from the 100 EMA ($77.83). Alternating candles show that buyers are catching price on the way down with bullish wicks in the green candles while holding support in the red candles. RSI is now at 71, indicating bullish momentum. Buyers are stepping in when it retraces so the structure is neutral to bullish above the 50 EMA even though the overall trend is down. Volume Profile is marking out $80 to $82 as an emerging Fair Value Area.
While searching for longs I will be looking for the price to breakout above resistance at $84.49 to $87.23. Based on the chart setup I would be looking to go long at $84.76 with a take profit at $87.23 and a stop below $82.31.