Tesla’s Bullish Structure Faces an Earnings Test
Tesla, Inc. (TSLA) is scheduled to report Q2 2026 earnings next Wednesday, July 22, after the market closes. What do the charts for TSLA suggest about the trend and key support and resistance levels? Starting with the weekly chart, the uptrend line was recently validated with a fourth touch and a successful test of support.
A higher swing low of $368.60 was the result, further confirming the bullish trend structure of higher swing lows. Moreover, the level is now a key support level based on trend structure. This makes the $368.60 level an important area to monitor, as a successful hold would preserve the broader uptrend.
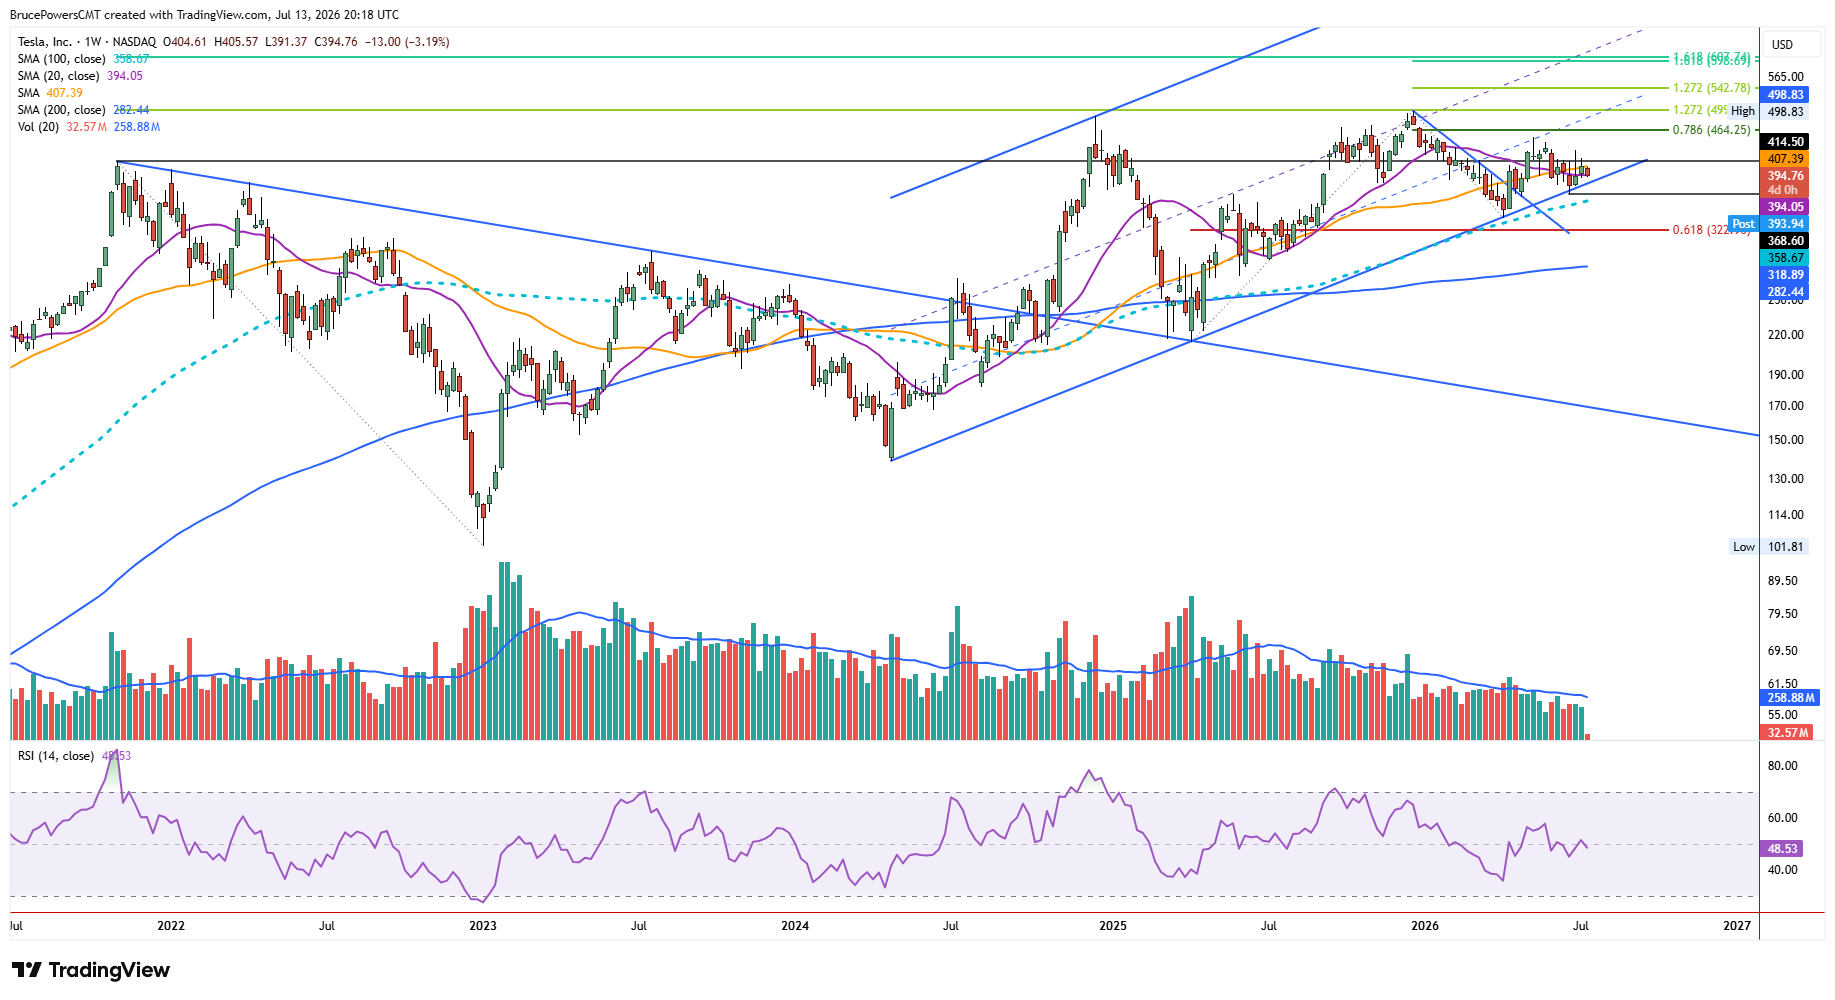
A drop below that level would signal a reversal of the uptrend and confirm a break below dynamic support at the uptrend line. That could lead to further selling and signs of weakness. The 100-week moving average near $358.66 and rising helps define dynamic support along with the uptrend line. Price was clearly rejected to the upside near that average during the formation of a higher swing low of $337.24 in April. Therefore, it could mark strong support again. A failure of this support zone would weaken the bullish structure and increase the risk of a deeper retracement.

Breakout Attempt Awaits Confirmation
TSLA has attempted to sustain a long-term bullish breakout above the top of a large basing pattern several times since December 2024. The original top of the base at $414.50 was broken to the upside for a third attempt in May of this year before a lower swing high was established at $453.40, leading to a retracement of the prior upswing.
Resistance Level Holds the Key to Renewed Momentum
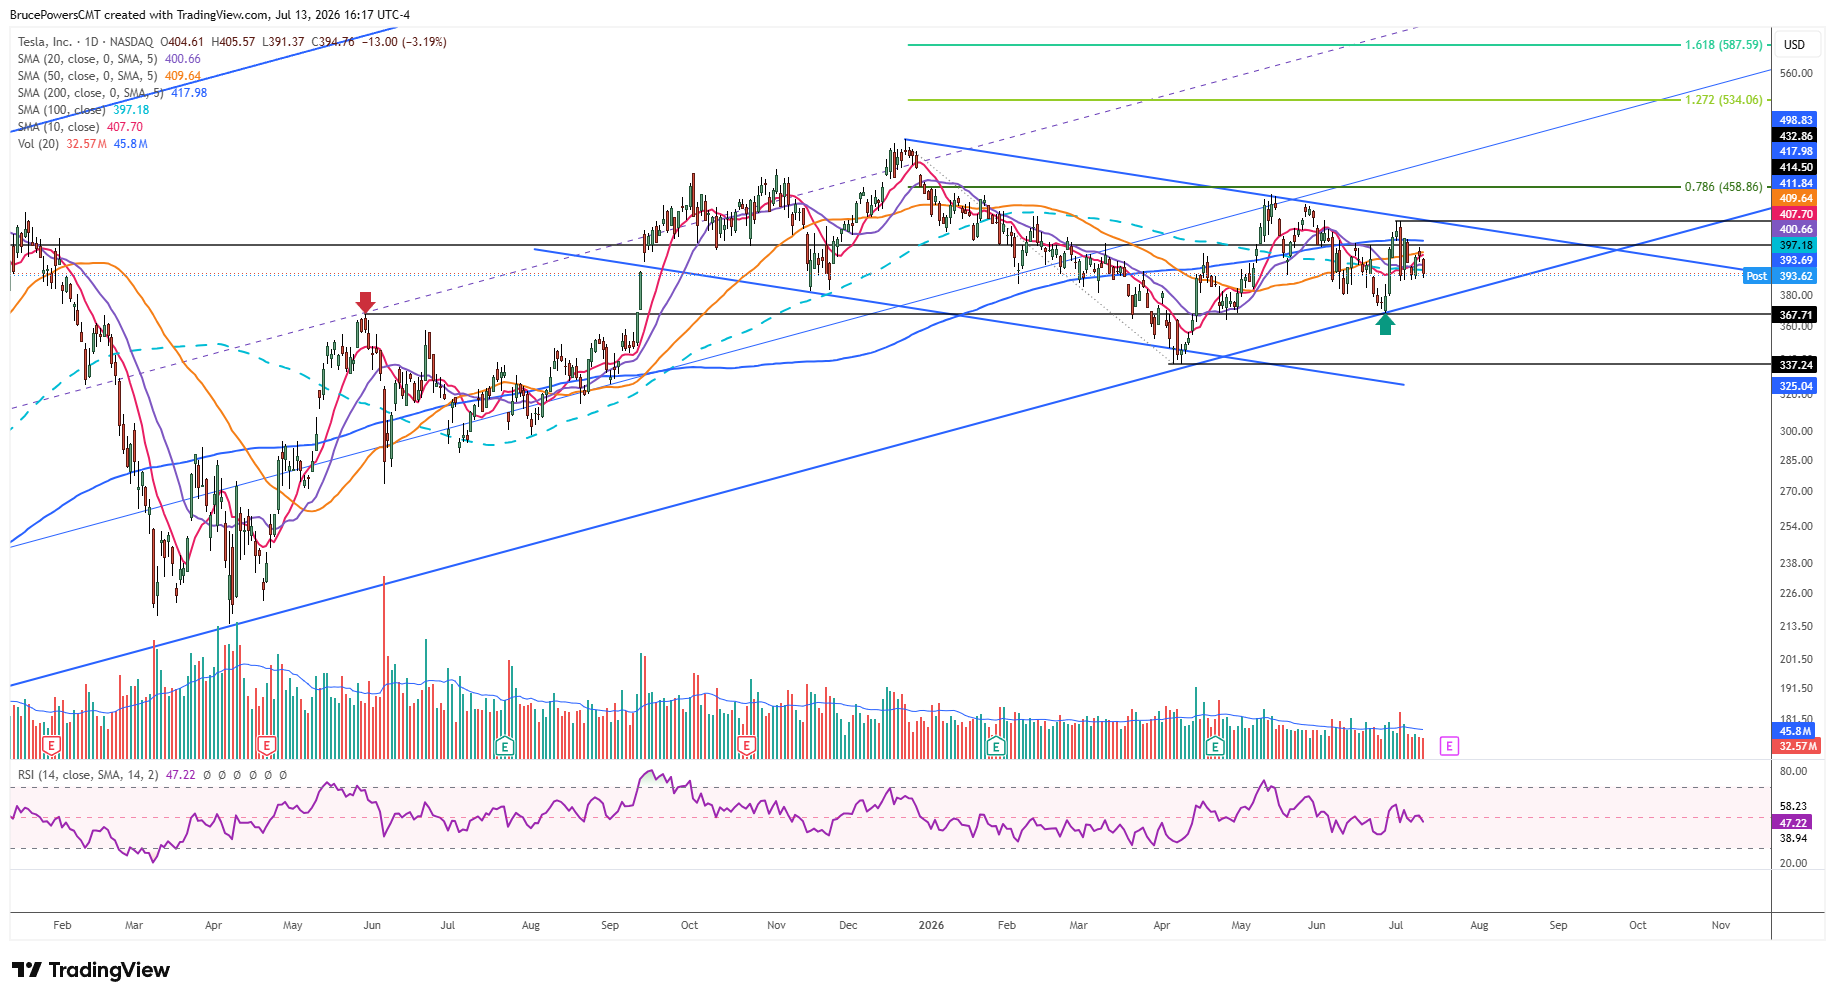
Given the sustained rising trend channel structure, an eventual resolution is likely to be to the upside unless key support levels are broken. A recent lower swing high of $432.86 marks a key trend structure level, as a sustained rally above that level will signal a reversal of the short-term decline and a breakout above the downtrend line. Those signs of strength would indicate a likely continuation of the developing bullish trend. Until then, TSLA remains in a consolidation phase within the broader uptrend, with support holding the key to maintaining the bullish outlook.
If you’d like to know more about technical analysis and how traders use it, please visit our educational area.