Chip Selloff Pulls Nasdaq Down Nearly 1%
The Nasdaq Composite dropped 1% Monday and the chip stocks drove every point of it. SK Hynix’s Nasdaq debut reversal spread across the entire sector. SanDisk fell 10%, Micron lost 6%, Seagate gave back 6%, and AMD and Intel both dropped around 4%. The AI spending thesis has not broken but the positioning was too crowded and Monday is the unwind.
Crude is the other problem. Trump posted on Truth Social calling the U.S. the “Guardian of the Hormuz Strait” and announced a 20% cargo reimbursement on all shipping through the waterway. WTI jumped more than 5% above $75 per barrel. Brent gained 5.3% to around $80.
The S&P 500 traded 0.4% lower. The Dow held up best, down about 56 points or 0.1%.

Daily September E-mini S&P 500 Index Futures Technical Analysis
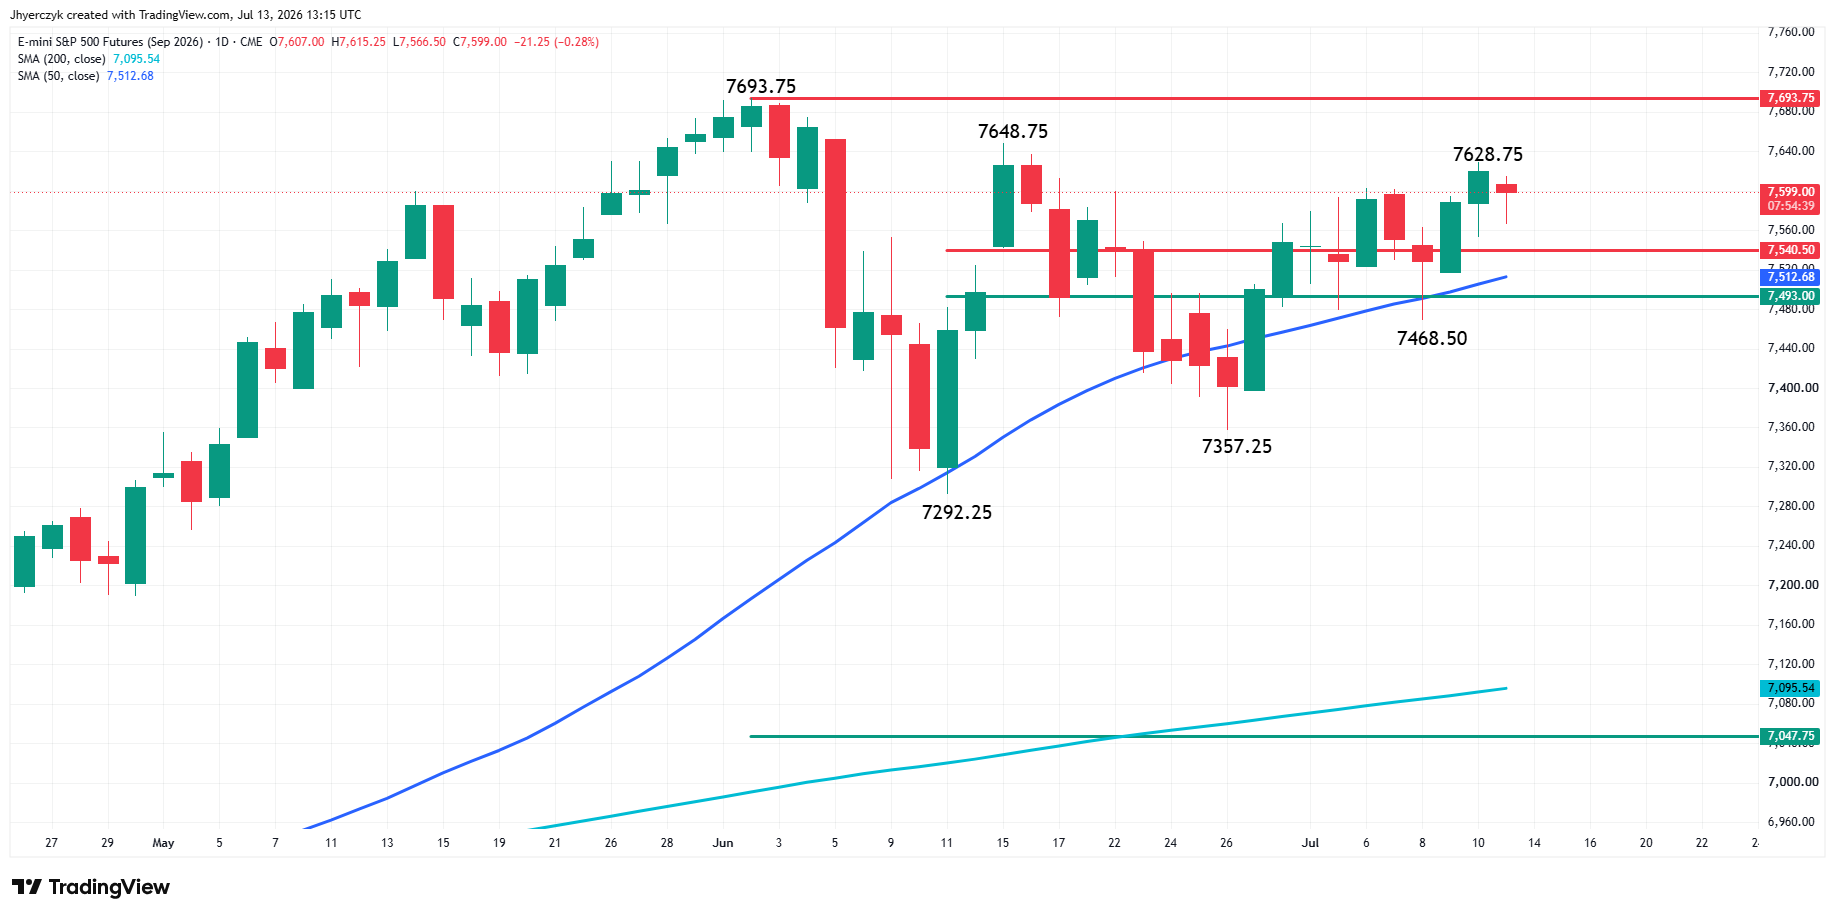
September E-mini S&P 500 Index futures are trading lower on Monday but rebounding from a steeper overnight decline. Despite the early weakness, the market is still well supported by Fibonacci support at 7540.50, the 50-day moving average at 7512.64 and the 50% level at 7493.00.
Traders are looking to extend the two-day rally which began on Thursday. Overtaking 7628.75 will signal the presence of buyers with the secondary higher top at 7648.75 the next target. This is the last potential resistance before the record high at 7693.75.
The strong upside momentum will remain intact unless the swing bottom at 7468.50 is violated.
Daily September E-mini Nasdaq-100 Index Futures Technical Analysis
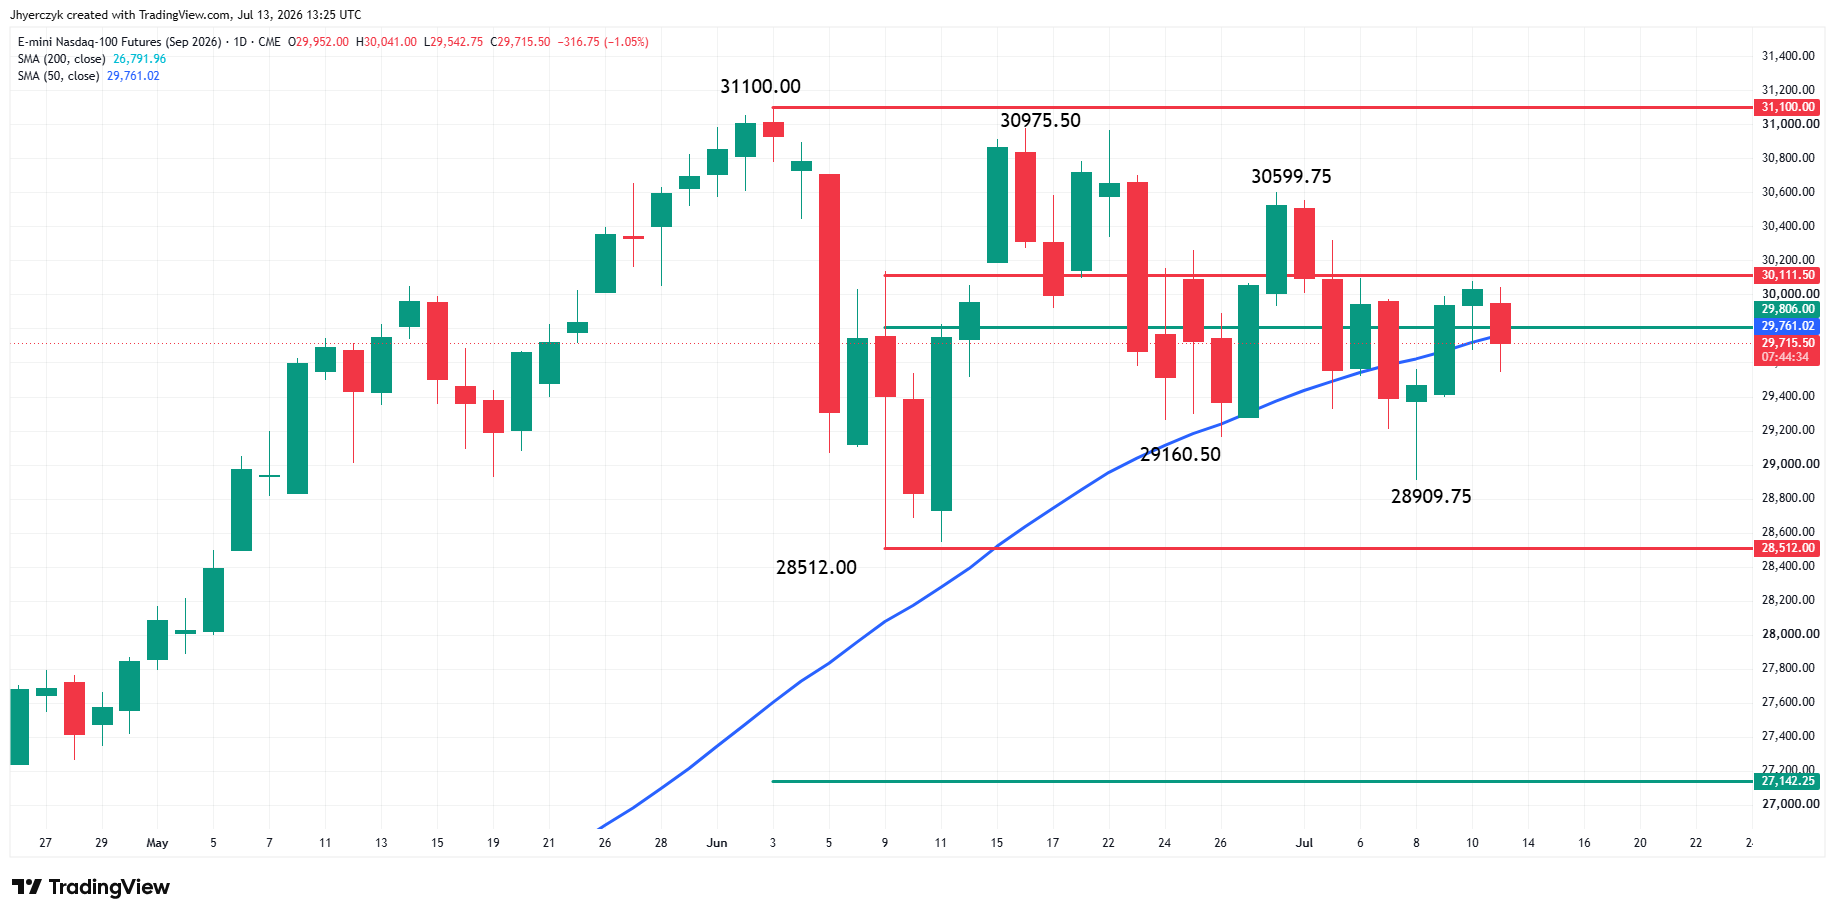
September E-mini Nasdaq-100 Index futures are lower on Monday. Early session selling drove the index to the weak side of the 50-day moving average at 29760.93 and now, traders are attempting to overcome this indicator. A sustained move under the 50-day MA will indicate the selling pressure is getting stronger. This will also put last week’s low at 28909.75 on the radar.
NASDAQ 100 Price Forecast
Every new NASDAQ 100 analysis as it publishes, today's technical signal and key levels, live price — on one page.
See all NASDAQ 100 forecastsRecovering the 50-day MA will signal the return of buyers, but bullish traders will still face headwinds at the short-term 50% level at 29806.00 and the 61.8% level at 30111.50. This is the trigger point for a potential acceleration to the upside. This rally will put the swing top at 30599.75 on the radar.
Daily September E-mini Dow Jones Industrial Average Futures Technical Analysis
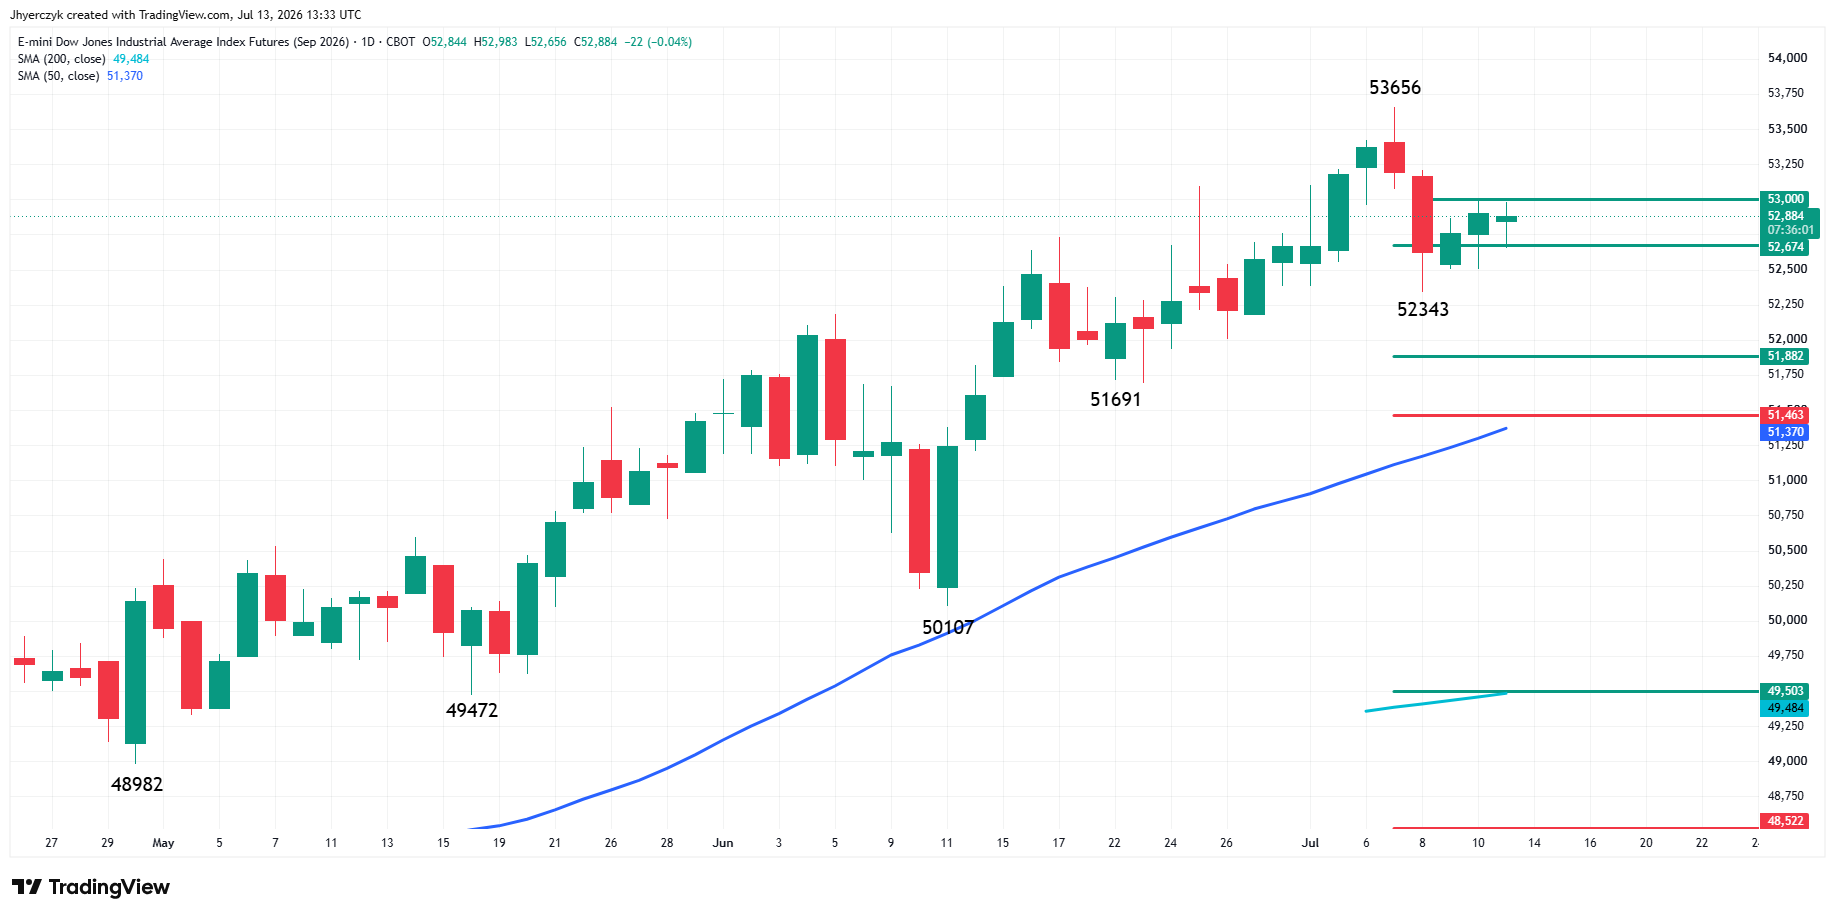
September E-mini Dow Jones Industrial Average futures are slightly lower on Monday. The main trend is up. A trade through 53656 will reaffirm the uptrend.
The E-mini Dow is trading between a pair of 50% levels at 52674 and 53000. This suggests trader indecision and impending volatility. Overtaking the upper level at 53000 will indicate the buying is getting stronger. If this creates enough upside momentum then look for a near-term drive into the record high at 53656. On the flipside, a drive through the support at 52674 will signal the presence of sellers. This could lead to a quick test of last week’s low at 52343.
The low at 52343 is just a price, it’s not a swing bottom. If the selling is strong enough then look for the move to continue into an intermediate retracement zone at 51882 to 41463. Even more important support is the 50-day moving average at 51373.
SK Hynix Took the Whole Group Down
The 13% debut-day pop lasted one session. SK Hynix gave back 7% Monday after Seoul sold it hard enough to post the stock’s largest single-day drop on record. By the time U.S. premarket opened the damage had already spread. The iShares Semiconductor ETF went with it and every memory name got hit.
The chip trade was overcrowded going into the week and SK Hynix gave everyone a reason to lighten up at the same time. That is a positioning flush, not a thesis breakdown.
Banks Report Into a Crowded Week
JPMorgan Chase, Goldman Sachs, Morgan Stanley, Bank of America, Citigroup, and Wells Fargo all report this week and their stocks were already trading lower ahead of the numbers. The 23% year-over-year earnings growth bar from FactSet is high enough to matter. Netflix, Johnson & Johnson, and UnitedHealth are also on deck.
The CPI print Tuesday is supposed to show headline inflation cooling 0.2% month-over-month but 3.8% on the annual rate is still running too hot. Warsh testifies before the House Financial Services Committee that same afternoon. A hot number with crude running the way it is gives him zero room to signal patience on rates.
What to Watch
Chip positioning and Hormuz risk are pulling in different directions Monday. The semiconductor unwind is a crowded-trade correction and bank earnings later this week decide whether money rotates or retreats. If the banks clear the earnings bar the tech weakness stays contained to chips.
The crude spike matters more Tuesday than it does today. Oil moving like that the day before CPI lands puts the inflation print in a different context. Warsh testifying that same afternoon gives the market two rate-sensitive catalysts in one session.
The Nasdaq-100 is the chart under the most pressure, sitting on its 50-day moving average with no buyers stepping in yet. A sustained break puts last week’s low on the table. The S&P 500 has more room to work with, still holding above Fibonacci support, but bulls need to retake 7628.75 to prove the two-day rally off Thursday’s low is still alive. The Dow is stuck between a pair of retracement levels and that range breaks one way or the other before the week is out.
More Information in our Economic Calendar.