


Selling Pressure Keeps Bears in Control
Sellers remained in charge of silver on Monday, as it fell below Friday’s low to reach a low of $57.27 for the session, signaling continued downward pressure unless signs of demand improve soon. A lower swing high of $63.27 was established last Monday, again confirming resistance at the downtrend line and the 20-day moving average, keeping the short-term downtrend intact. Friday’s slightly higher daily high of $60.77 once again confirmed resistance near those declining trend indicators, as well as near the prior trend low of $61.51 from June.
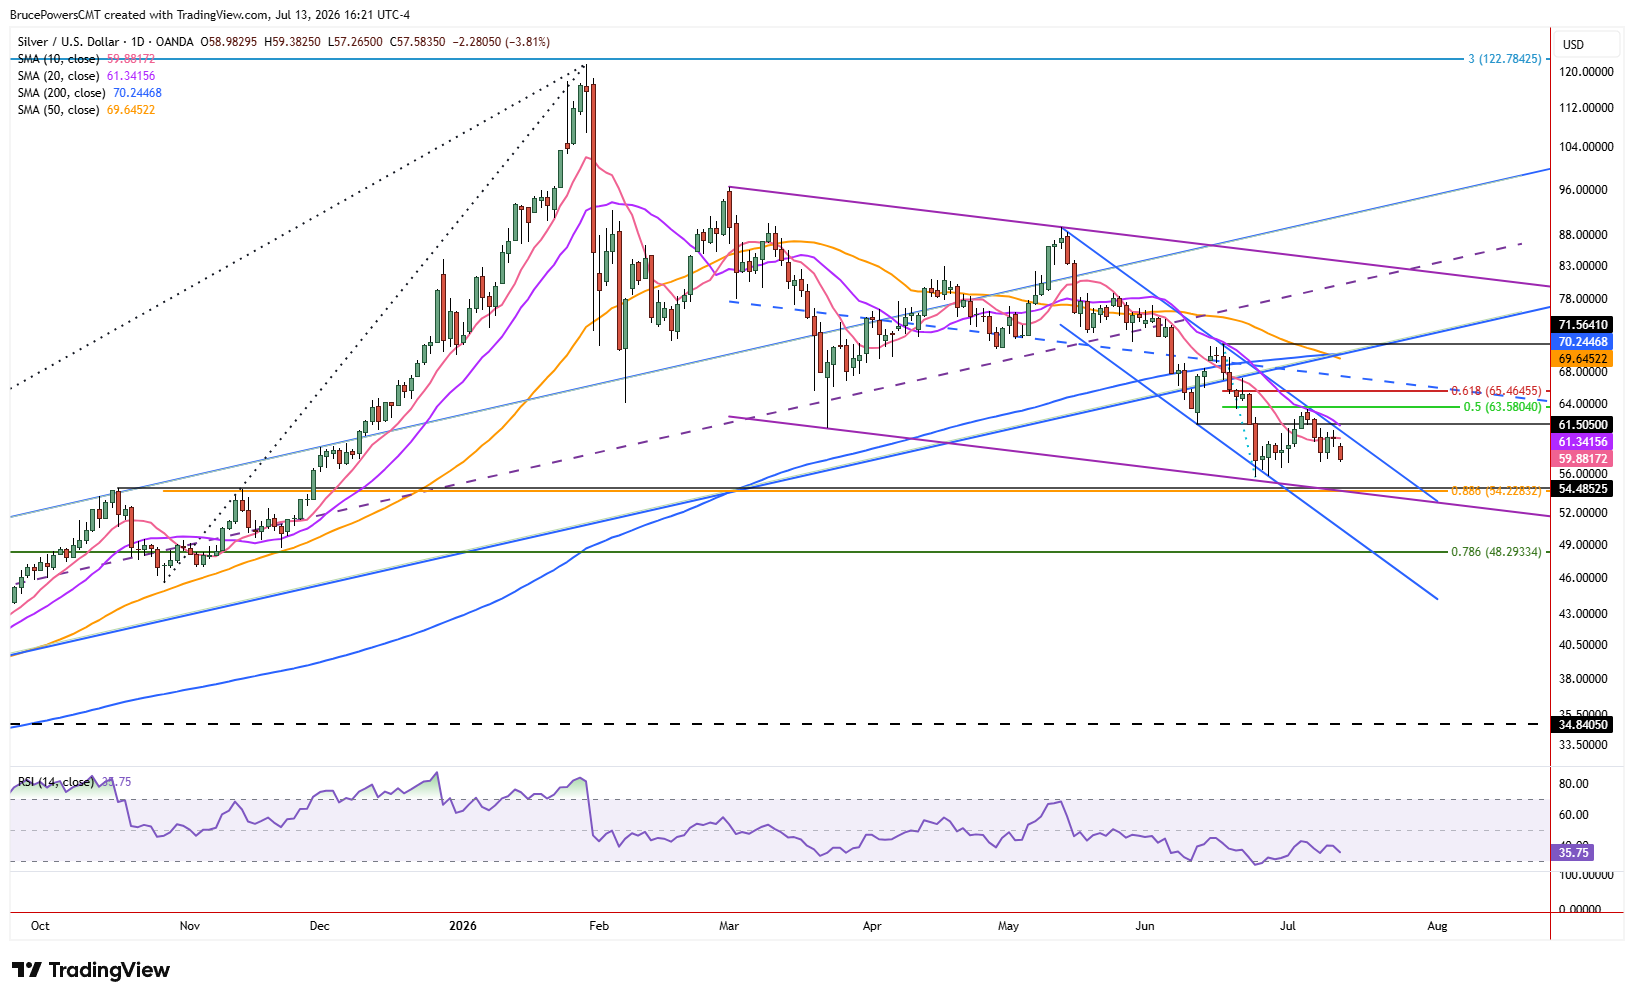
Trading was continuing near the session lows at the time of writing, and prices could move lower by the end of the session. This may leave silver with its lowest daily closing price for this year’s bearish correction, providing another sign of increasing selling pressure. With sellers continuing to control price action, attention remains focused on whether support can withstand another test.

Key Support Zone Faces Another Test
Monday’s price action confirms that the short-term declining trend structure, with dynamic resistance near the 20-day moving average, continues to dominate price action. This suggests that silver could further test support near the trend low of $55.60 or break below that level. A decisive decline could lead to a more significant test of support at the next lower target zone, defined by the confluence of several indicators, including the October 2025 high of $54.49 and the 88.6% Fibonacci retracement of the previous upswing at $54.23. Also cutting through that area is the lower boundary line of a falling trend channel. Price was recently rejected from support near the lower boundary, reinforcing its significance as a key technical level.
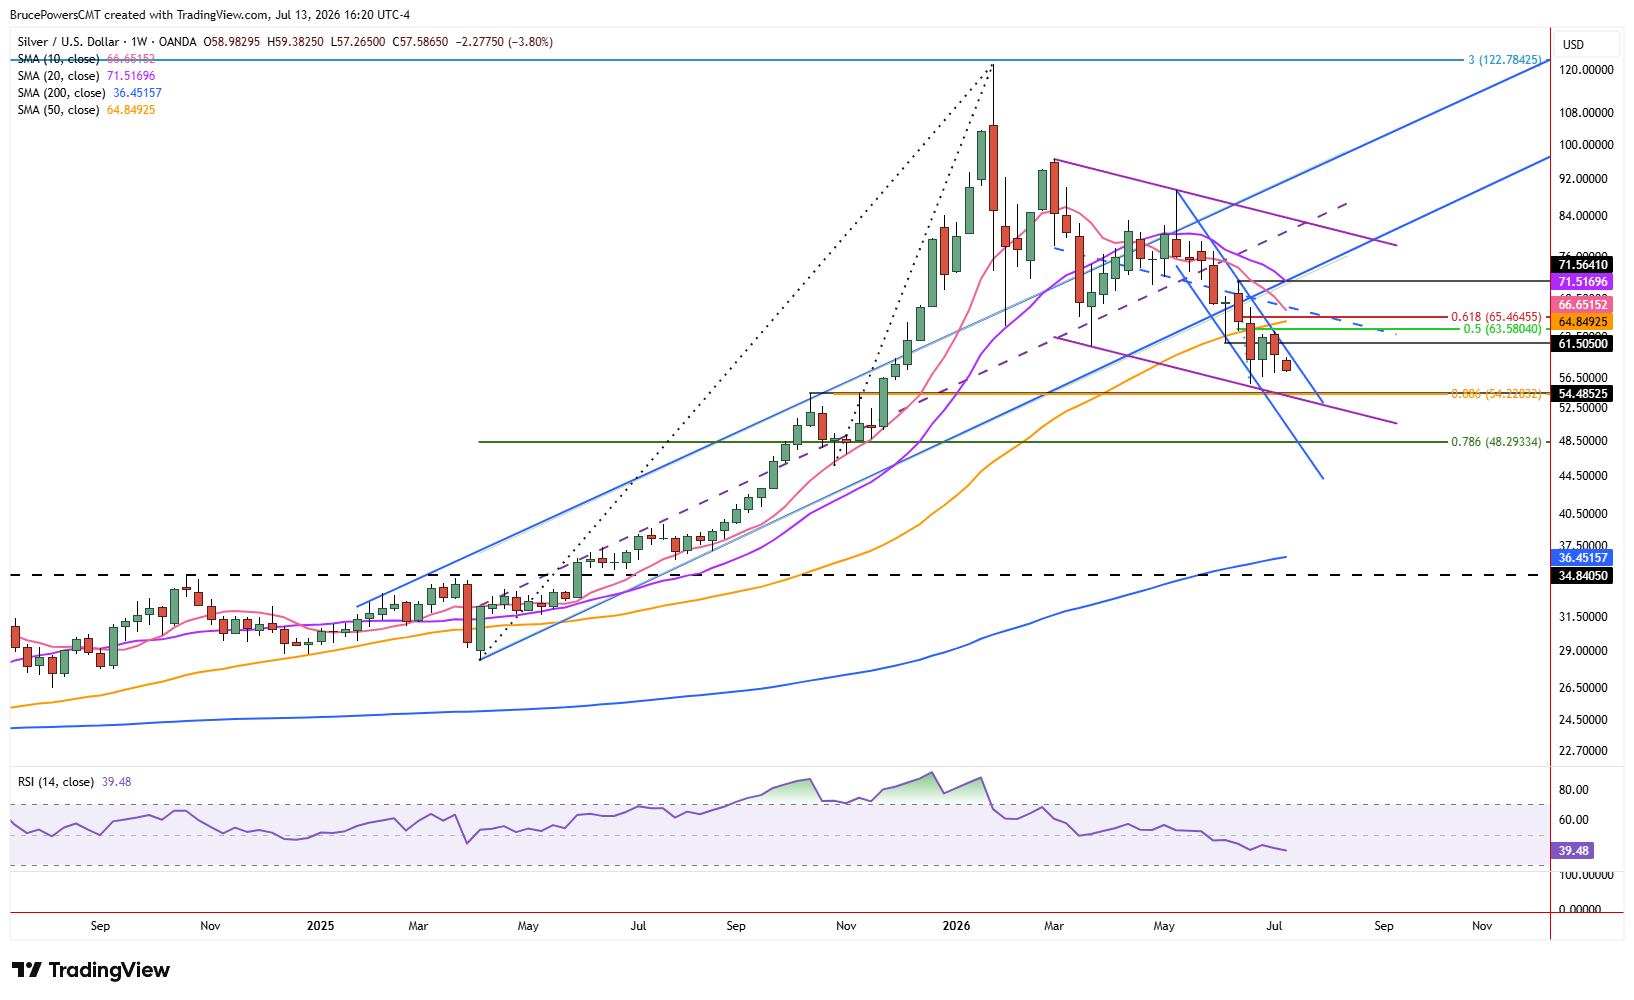
A drop below Friday’s low of $57.22 would indicate continued weakness toward that next support zone, where traders will look for signs of support to emerge. Nonetheless, there remains the possibility that support could fail in that price zone as well. If that occurs and silver records a decisive decline below $54.23, the lower target would be the 78.6% Fibonacci retracement level at $48.29.
Resistance Must Break to Shift Momentum
Key near-term resistance is defined by a range from around $60.77 to $61.34, with the higher level represented by the falling 20-day moving average. Before there is a chance for higher prices, the 20-day moving average must first be reclaimed, followed by further signs of strength. Until then, the bearish trend remains in control, leaving the support levels discussed above as the market’s primary focus.
If you’d like to know more about how to trade gold and silver, please visit our educational area.



