



Meta Beat Fails to Offset Tesla Selloff
U.S. futures are lower early Thursday despite solid reports from Meta and Tesla. A sell-off in Asia is doing the damage.
Meta beat on revenue, while issuing strong current-quarter guidance. It also narrowed its full-year data-center spending range. The stock is modestly lower in pre-market trading. That should have helped the AI trade. Instead, it is only cushioning it. Tesla also beat on revenue and earnings, yet its shares are sharply lower.
Nasdaq-100 futures are off 1.8%. S&P 500 futures have lost 1.02%, and Dow futures are lower by 0.66%.
Daily December E-mini S&P 500 Index Futures Technical Analysis
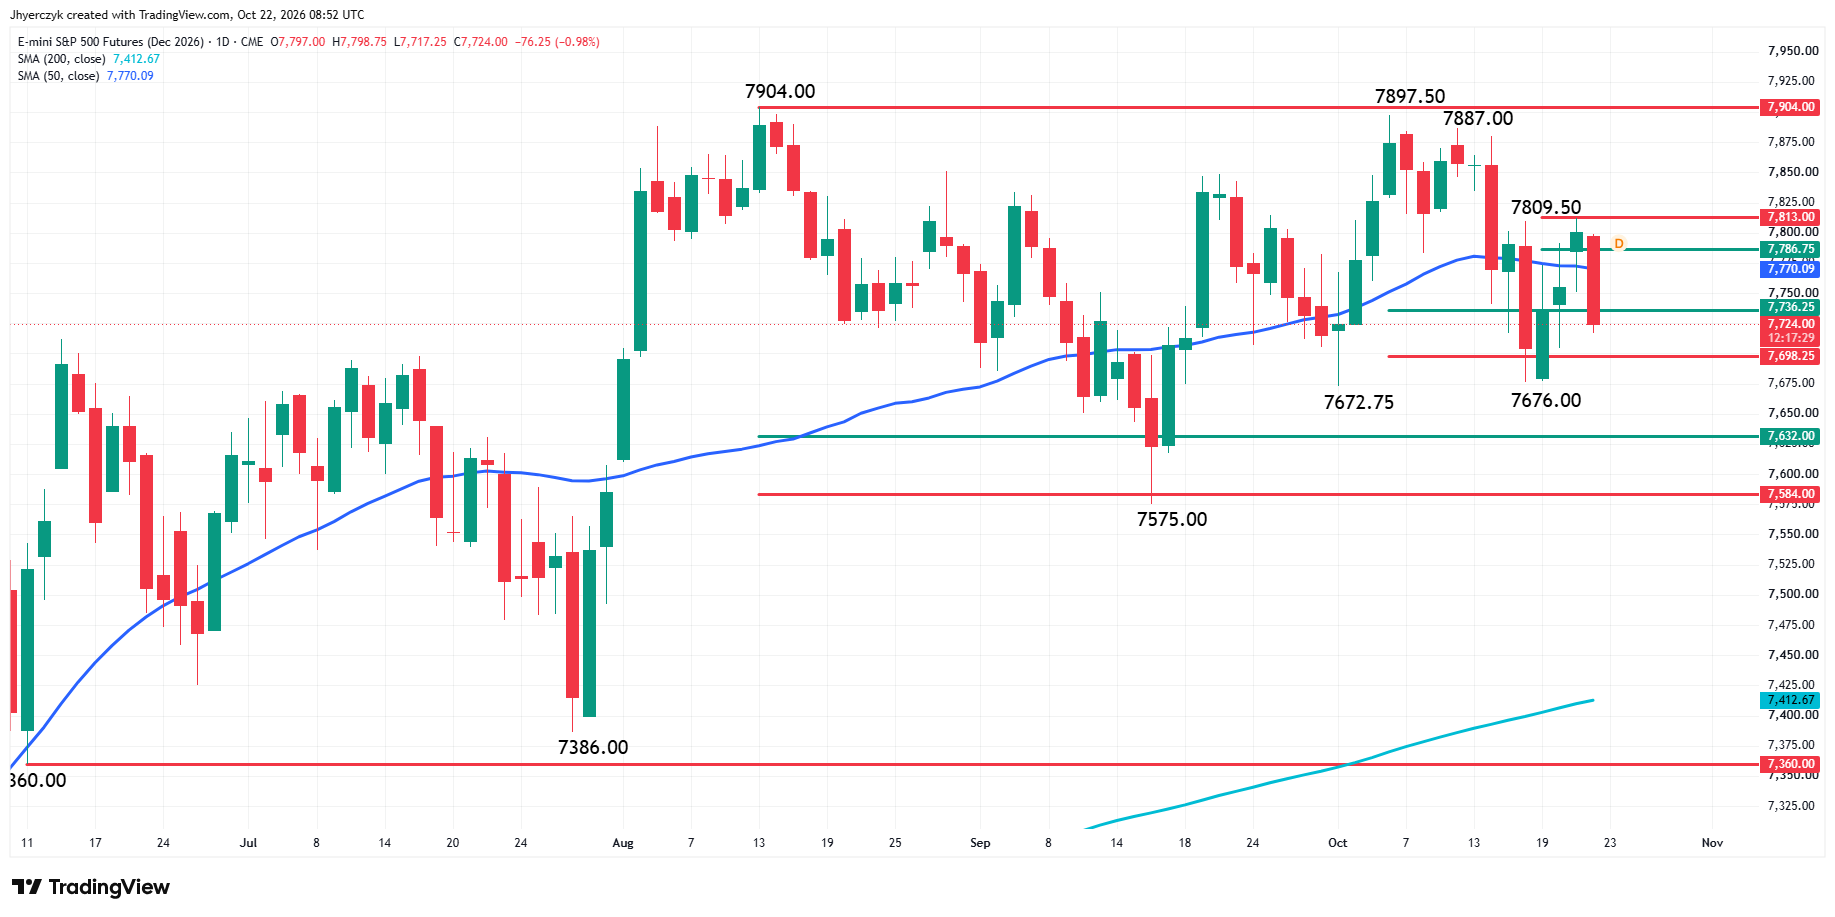
December E-mini S&P 500 Index futures are sharply lower in the premarket session after failing to exceed a key retracement area and crossing to the weak side of the 50-day moving average.
The main trend is down according to the daily swing chart. A trade through 7676.00 will signal a resumption of the downtrend. The main trend changes to up on a move through 7887.00. It will be reaffirmed if buyers can take out 7897.50 and the record high at 7904.00.
The minor trend is up. It turned up on Wednesday when buyers took out 7809.50. A trade through 7676.00 will change the minor trend to down.
Swing chart resistance is the retracement zone at 7786.75 to 7813.00. This zone stopped the rally at 7809.50 on Wednesday.
Potential swing chart support at 7736.25 to 7698.25 is currently being tested. Trader reaction to 7736.25 is likely to set the tone today.
A sustained move over 7736.25 will indicate the return of buyers. If this creates enough upside momentum then look for the rally to possibly extend into the 50-day moving average at 7770.09, then the retracement zone at 7786.75 to 7813.00.
A sustained move under 7736.25 will signal increasing selling pressure. This could lead to a break into the 61.8% level at 7698.25. If it fails then look for the selling to extend into the two main bottoms at 7676.00 and 7672.75. If these levels fail then look for a test of the intermediate retracement zone at 7632.00 to 7584.00.
S&P 500 Price Forecast
Every new S&P 500 analysis as it publishes, today's technical signal and key levels, live price — on one page.
See all S&P 500 forecastsDaily December E-mini Nasdaq-100 Index Futures Technical Analysis
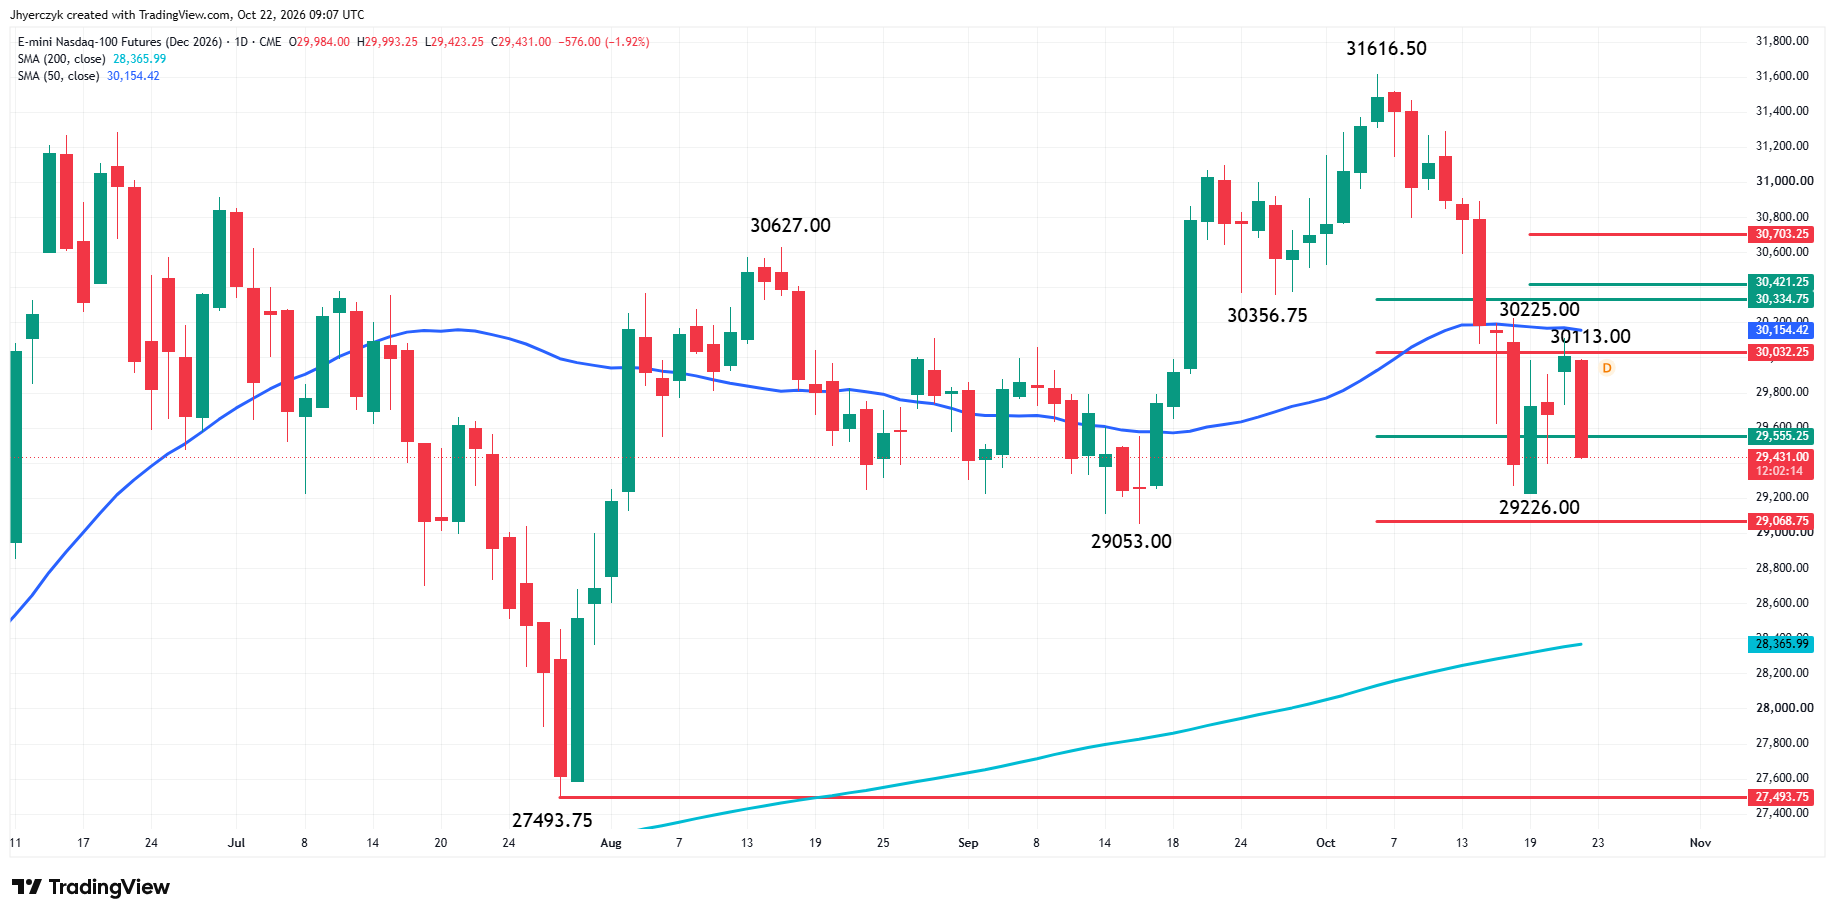
December E-mini Nasdaq-100 Index futures are under pressure early Thursday. The inability to recapture the 50-day moving average at 30154.26 on Wednesday is likely contributing to the weakness.
The main trend is down according to the daily swing chart. A trade through the record high at 31616.50 will change the main trend to up. A trade through the swing bottom at 29226.00 will signal a resumption of the downtrend.
The minor trend is also down. A trade through 30113.00 will change the minor trend to up. Taking out the minor top at 30225.00 will reaffirm the change in the minor trend.
Retracement zone resistance is stacked at 30032.25 to 30334.75 and 30421.25 to 30703.25. The 50-day moving average sits inside the former range, as well as Wednesday’s high at 30113.00.
Retracement zone support is 29555.25 to 29068.75. This zone is currently being tested. On Monday, it provided support at 29226.00. The tone of the market today is likely to be determined by trader reaction to the 50% level at 29555.25.
A sustained move over 29555.25 will signal the return of buyers. If this creates enough upside momentum then look for a possible retest of 30032.25 to 30334.75.
A sustained move under 29555.25 will indicate the presence of sellers. If this creates enough downside momentum then look for the selling to possibly extend into the minor bottom at 29226.00, the 61.8% level at 29068.75 and the main bottom at 29053.00. Breaking the main bottom could trigger an acceleration into the 200-day moving average at 28366.11.
What to Watch
Weekly initial jobless claims are the next economic report. Meta’s earnings are providing support to the technology trade, but Tesla’s premarket loss, and weakness in overseas markets are keeping the sellers active.
My bias for December E-mini S&P 500 Index futures is bearish. Another possible lower top at 7809.50, the break under the 50-day moving average and the downtrend on the swing chart support the outlook. Recapturing the 50-day moving average at 7770.09 would weaken it.
The downtrend on the swing chart and trade on the weak side of the 50-day moving average support a bearish bias for December E-mini Nasdaq-100 Index futures. A sustained move over 29555.25 would weaken that view.
More Information in our Economic Calendar.