



The major U.S. stock indexes are up for a second session on Tuesday. The rally continues to be fueled by strong gains in the chipmakers. Lower crude oil prices are also lending support. However, gains seem to be limited by uncertainty ahead of the Fed’s interest rate decision on Wednesday and a slew of major earnings reports throughout the week.
The Fed started its two-day meeting on Tuesday. Although policymakers are expected to keep rates unchanged, traders are more interested in their future projections. Inflation is the key issue. Ahead of tomorrow’s announcement, traders are already pricing in a 25 basis point rate hike in December.
At 15:23 GMT, the S&P 500 Index is trading 7720.88, up 44.11 or +0.57%. The Nasdaq Composite Index is at 26440.869, up 271.488 or +1.04% and the Dow Jones Industrial Average is trading 52412.32, up 50.74 or +0.10%.
Daily S&P 500 Index (SPX) Technical Analysis
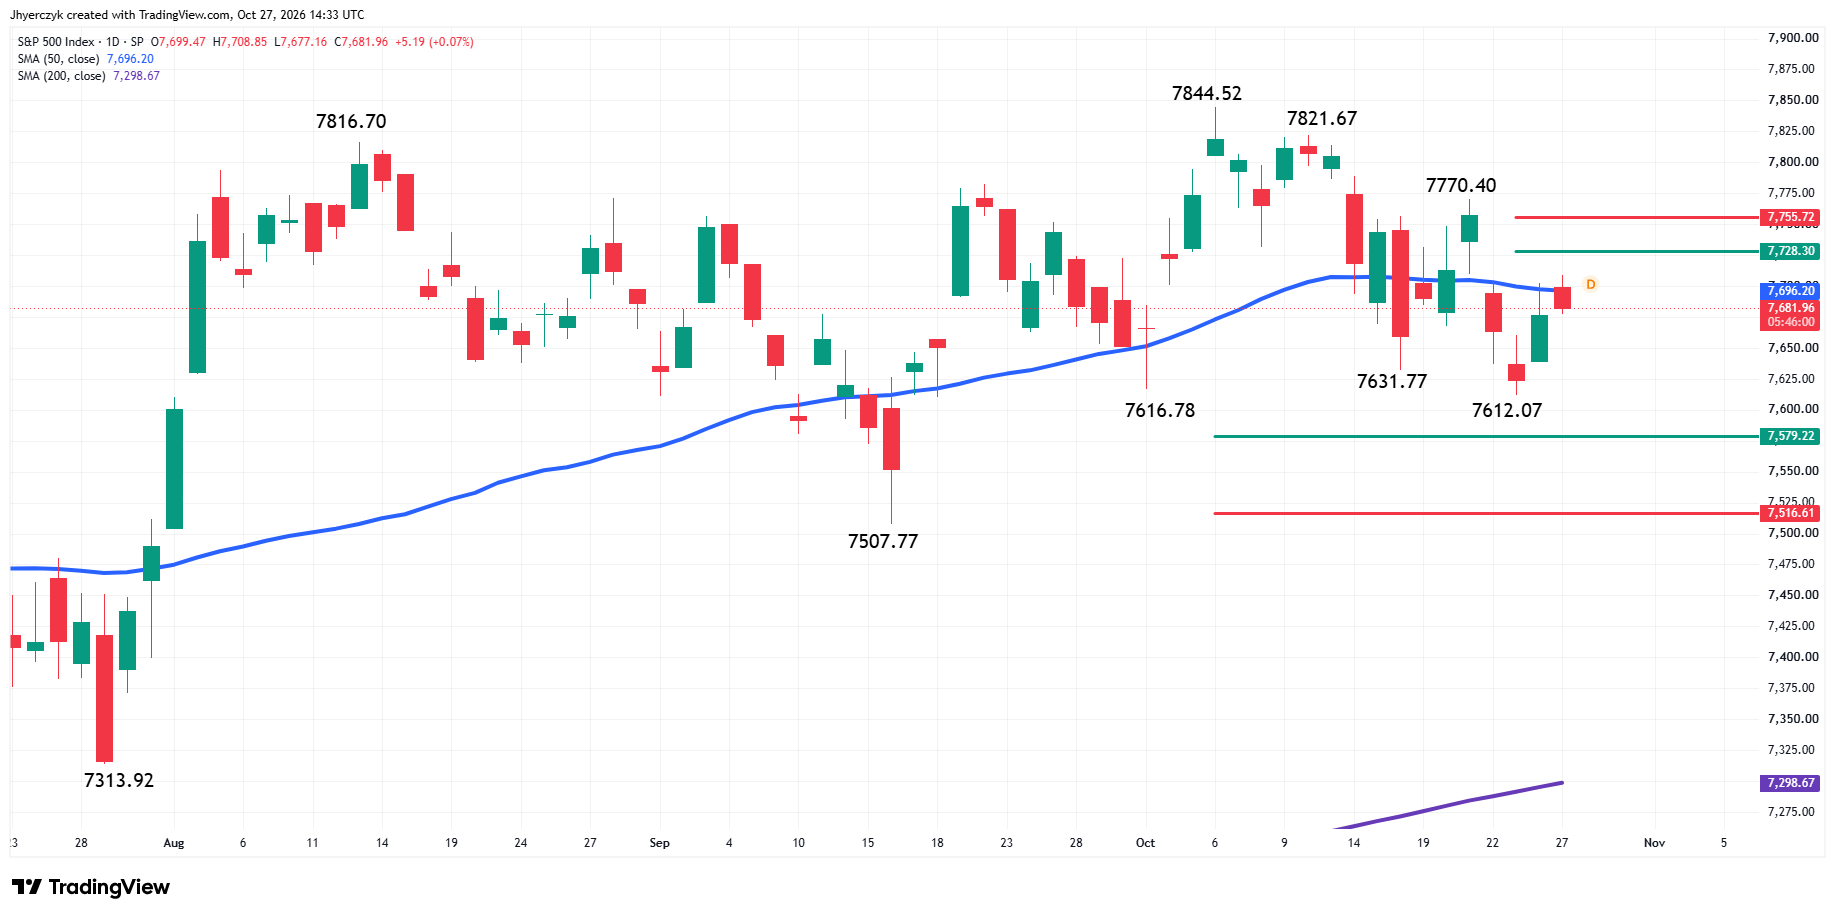
The S&P 500 Index is edging higher shortly after the opening on Tuesday. The early price action suggests traders may be trying to trigger a breakout over the 50-day moving average at 7696.32. This move could lead to increased upside momentum.
The main trend is down according to the daily swing chart. The main trend will change to up if buyers can take out the last swing top at 7770.40. A trade through 7612.07 will signal a resumption of the downtrend.
The short-term range is 7844.52 to 7612.07. Its retracement zone at 7728.30 to 7755.72 is the next potential upside target.
The long-term range is 7313.92 to 7844.52. Its retracement zone at 7579.22 to 7516.61 is major support.
The swing chart is in a downtrend, but the market is threatening to overtake the 50-day moving average at 7696.32, which could shift momentum to the upside. This could then extend the rally into the short-term retracement zone at 7728.30 to 7755.72.
Sellers could return on a rally into the short-term retracement zone. Bearish traders are likely to defend against a breakout over 7770.40 and a change in trend to up.
S&P 500 Price Forecast
Every new S&P 500 analysis as it publishes, today's technical signal and key levels, live price — on one page.
See all S&P 500 forecastsDaily Nasdaq Composite (IXIC) Technical Analysis
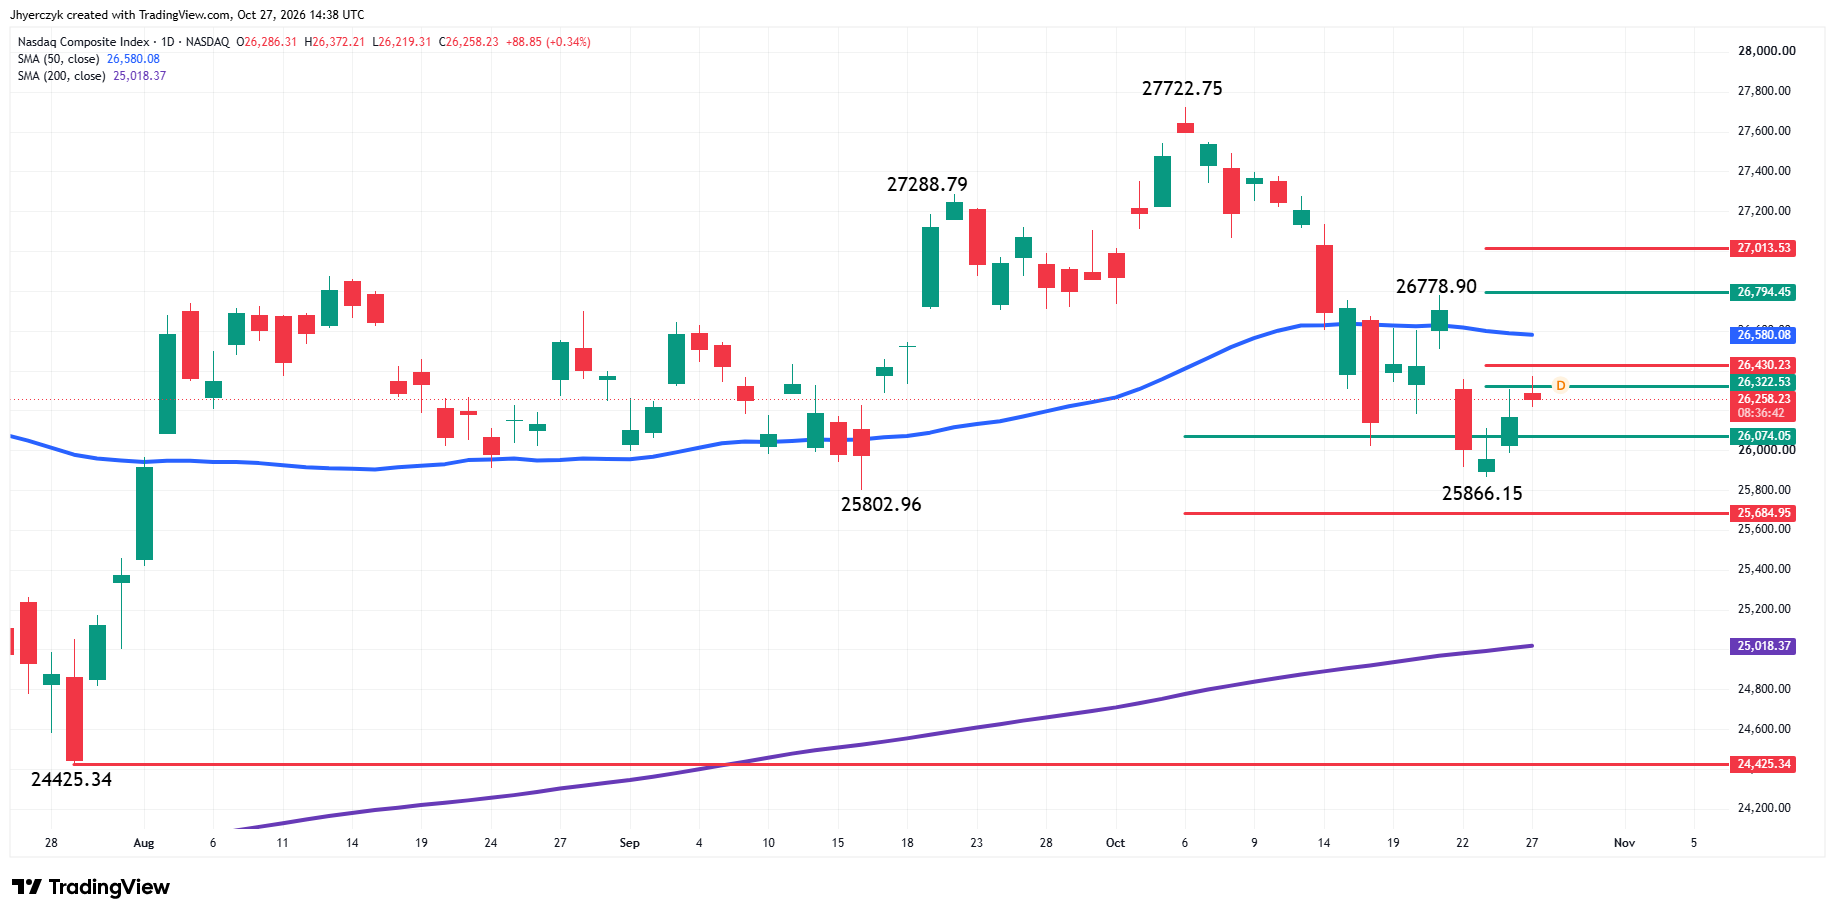
The Nasdaq Composite is higher on Tuesday. The main trend is down according to the daily swing chart. A trade through 25866.15 will signal a resumption of the downtrend. The main trend will change to up if buyers can take out the swing top at 26778.90.
The long-term range is 24425.34 to 27722.75. Its retracement zone is support at 26074.05 to 25684.95. The current two-day rally began after a low was formed inside this zone on Friday at 25866.15. If this counter-trend move creates enough upside momentum then look for a near-term surge into the 50-day moving average at 26580.19.
The 50-day moving average may be the indicator that determines whether the rally stalls or continues. If it stalls, we’re likely to see a retest of 26074.05 to 25684.95. If buyers trigger a breakout over the 50-day moving average then look for a follow-through move into the swing top at 26778.90. If buyers overcome this level then look for the trend to change to up and for the rally to possibly extend into at least 26794.45.
Daily Dow Jones Industrial Average (DJI) Technical Analysis
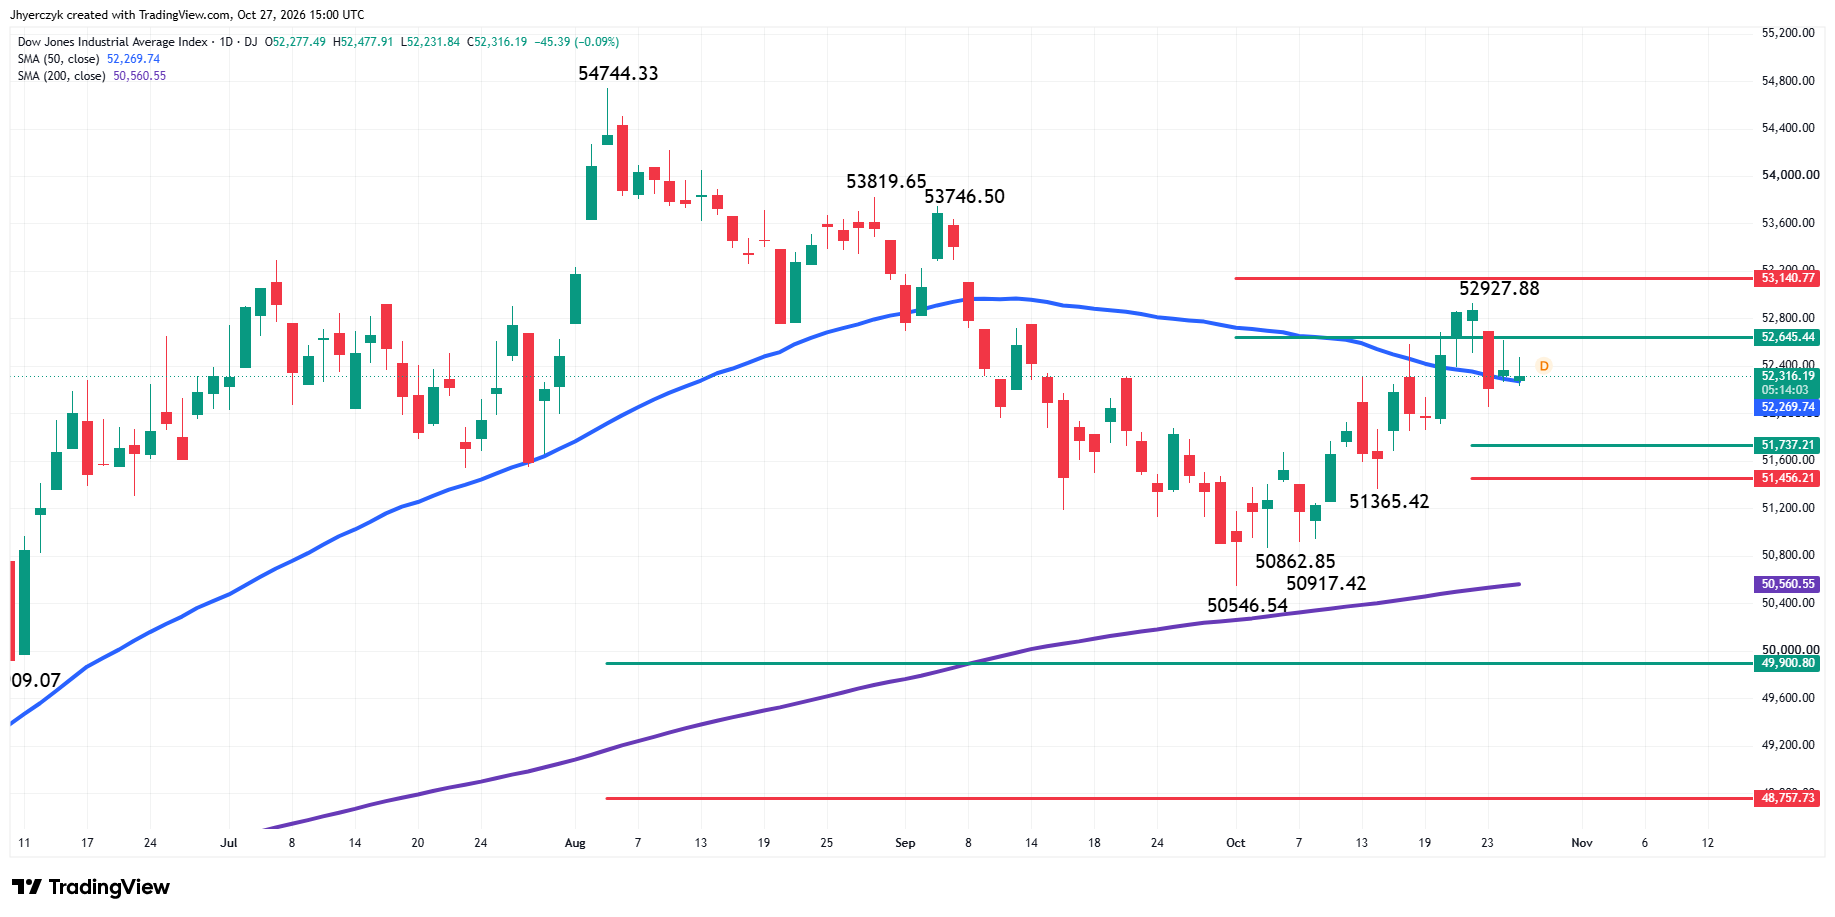
The Dow is struggling on Tuesday as traders navigate the 50-day moving average at 52269.91. Trader reaction to this indicator could determine whether the market tries to extend the current rally or begin a short-term correction.
The main trend is up according to the daily swing chart. A trade through 52927.88 will reaffirm the uptrend. The main trend changes to down on a break through 51365.42.
The intermediate range is 54744.33 to 50546.54. Its retracement zone at 52645.44 to 53140.77 stopped the current rally at 52927.88 on Friday.
The short-term range is 50546.54 to 52927.88. If the selling pressure takes out the 50-day moving average then look for the move to possibly extend into its retracement zone at 51737.21 to 51456.21.
What to Watch
S&P 500 Index
My bias is still to the downside because of the swing chart downtrend, but my outlook will weaken if buyers can overcome the 50-day moving average at 7696.32. If that’s the case today, new buyers may try to extend the counter-trend rally into the retracement zone at 7728.30 to 7755.72.
If you’re short with the trend indicator, keep in mind that you may take heat up to 7770.40 if there is a clean breakout over the 50-day moving average. If the rally stalls at the 50-day moving average then that will tell us that today’s buying is weak and that short-sellers may still be in control.
Nasdaq Composite
The swing chart is trending lower, but the price action suggests buyers may have found strong support at 26074.05 to 25684.95.
The new short-term range is 26778.90 to 25866.15. Its retracement zone is 26322.53 to 26430.23. Trader reaction to this zone is likely to determine the near-term price action. This zone was tested early in the session on Tuesday, but was rejected at 26372.21.
Overcoming the 61.8% level at 26430.23 could spike prices into the 50-day moving average later today. However, a sustained move under 26322.53 could lead to a retest of the long-term 50% level at 26074.05.
Dow Jones Industrial Average
The Dow trend is up according to the swing chart so my bias is to the upside. The rejection at 52927.88 and the break back under the intermediate retracement zone has weakened my outlook, however.
Crossing over to the weak side of the 50-day moving average at 52269.91 will weaken my outlook further. This could create the downside momentum to challenge the short-term retracement zone at 51737.21 to 51456.21.
More Information in our Economic Calendar.