


Stocks Recover From Early Selling as Nvidia Losses Ease
Volatility is the early theme in the U.S. stock indexes as we approach the midsession on Thursday. Both the S&P 500 Index and the Nasdaq Composite Index have turned higher after posting early declines of 0.8% and 1.5%, respectively. Meanwhile, the Dow has recovered from earlier weakness and is now trading above its earlier 108-point gain.
At 17:27 GMT, the S&P 500 Index is trading at 7643.37, up 23.99 or +0.31%. The Nasdaq Composite Index is at 25547.843, up 81.654 or +0.32% and the Dow Jones Industrial Average is trading at 52717.57, up 231.08 or +0.44%.
Nvidia Selling Eases as Competitors Rally
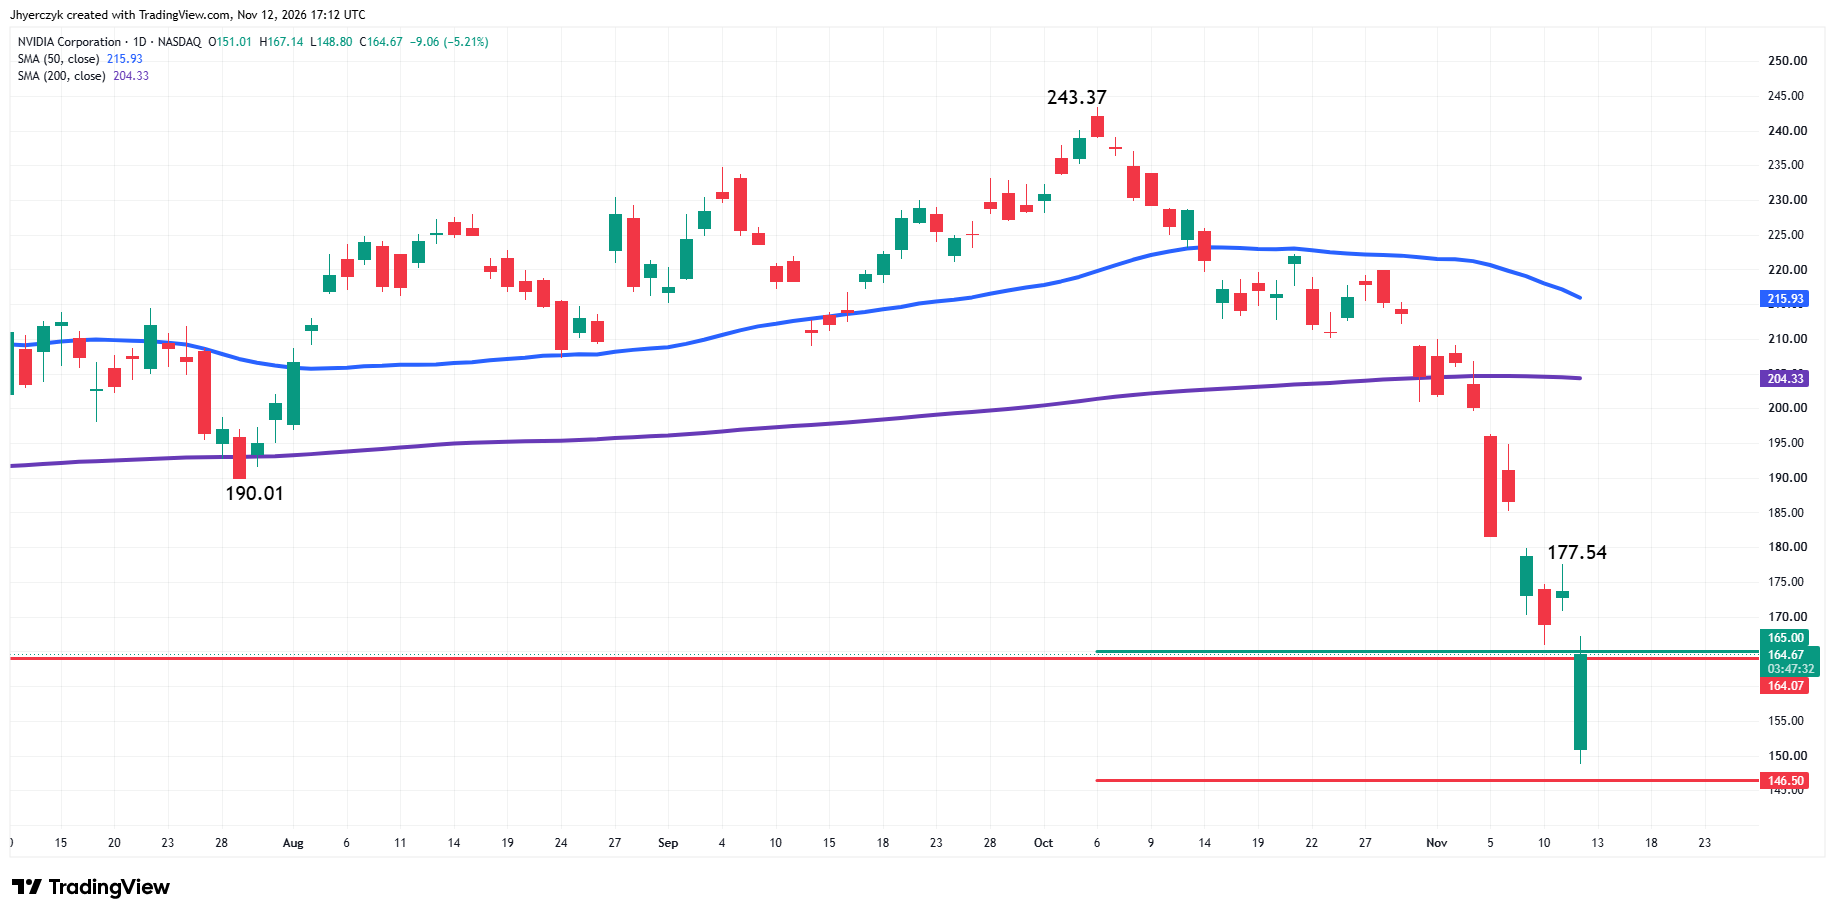
The primary driver of today’s earlier weakness appears to have been the fallout from a scandal at Nvidia, which led to the resignation of CEO Jensen Huang. The chip giant is currently down about 4% after dropping more than 10% earlier.
The fallout from Nvidia could keep pressure on the stock market as investors reassess the company’s value without Huang at the helm. Some investors may have considered Huang’s vision and ability to guide the company when evaluating Nvidia’s value and stock price.
Despite Nvidia’s weakness, some investors appear to be moving into competitors like Advanced Micro Devices and Broadcom, which are higher by 4% and 5%, respectively. The recovery in the major indexes suggests investors may feel that the market is bigger than the Nvidia event.
Oil, Inflation and Jobless Claims in Focus
Investors were also being influenced by new concerns over Iran and the latest jobless claims report. Treasury yields rose along with oil prices after President Trump said, “We don’t need a deal with Iran. Those days have long since passed. We’ve got their money. Hundreds of Billions of Dollars, and we’ve got their Strait.”
S&P 500 Price Forecast
Every new S&P 500 analysis as it publishes, today's technical signal and key levels, live price — on one page.
See all S&P 500 forecastsAlthough the indexes have recovered, investors may still be worried about higher oil prices weighing on economic growth and driving lingering inflation. Higher inflation could mean a more hawkish Fed for longer and keep interest rates elevated. Investors don’t want to see higher rates because they tend to draw money out of the stock market and into Treasurys. Furthermore, they come at a time when AI-related companies are looking to finance large datacenters.
In economic news, initial jobless claims jumped last week after hovering around their lowest levels in decades. Investors will be watching for further signs of labor market weakness, which could limit the Fed’s ability to raise rates aggressively.
Daily S&P 500 Index (SPX) Technical Analysis
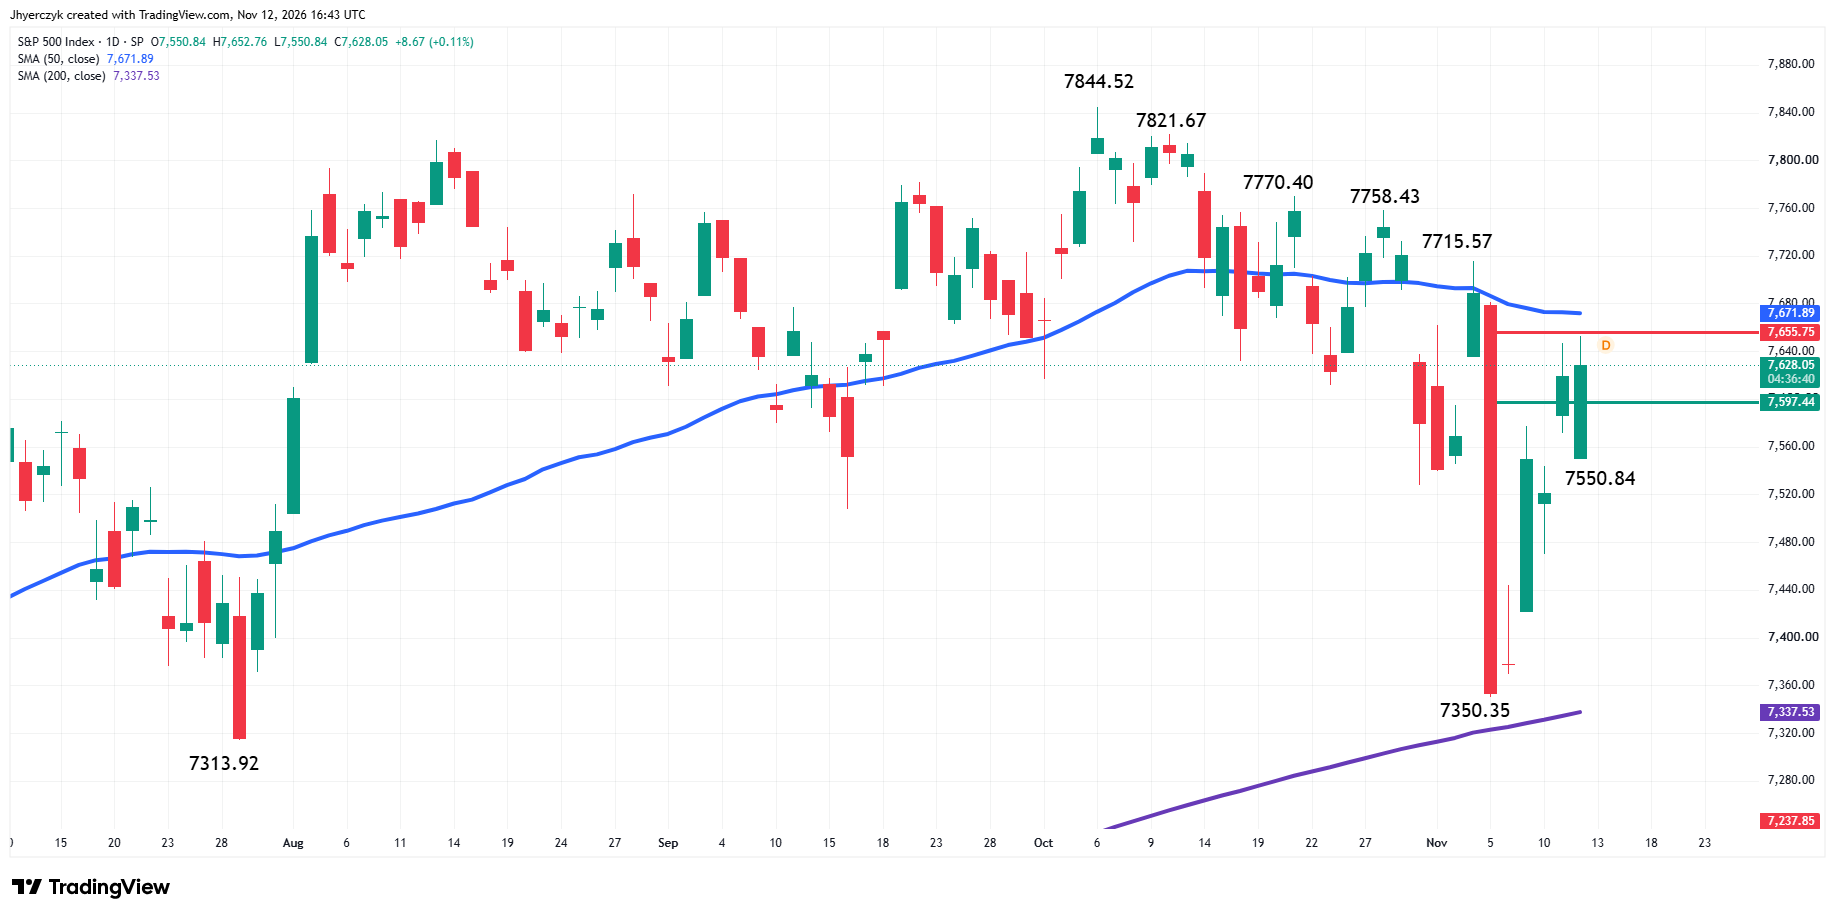
The S&P 500 Index is higher on Thursday as we approach the mid-session. The main trend is down according to the daily swing chart, but the minor trend is higher, leading to a shift in momentum to the upside.
The main trend will change to up on a breakout over 7715.57. A trade through 7350.35 will signal a resumption of the downtrend.
The minor trend is up. It changed to up earlier today when buyers took out yesterday’s high at 7647.20. The intraday reversal shifted momentum to the upside. A trade through 7550.84 will change the minor trend to down.
The intermediate range is 7844.52 to 7350.35. The market is currently testing its retracement zone at 7597.44 to 7655.75. This is followed by the 50-day moving average at 7671.89.
Daily Nasdaq Composite Index (IXIC) Technical Analysis
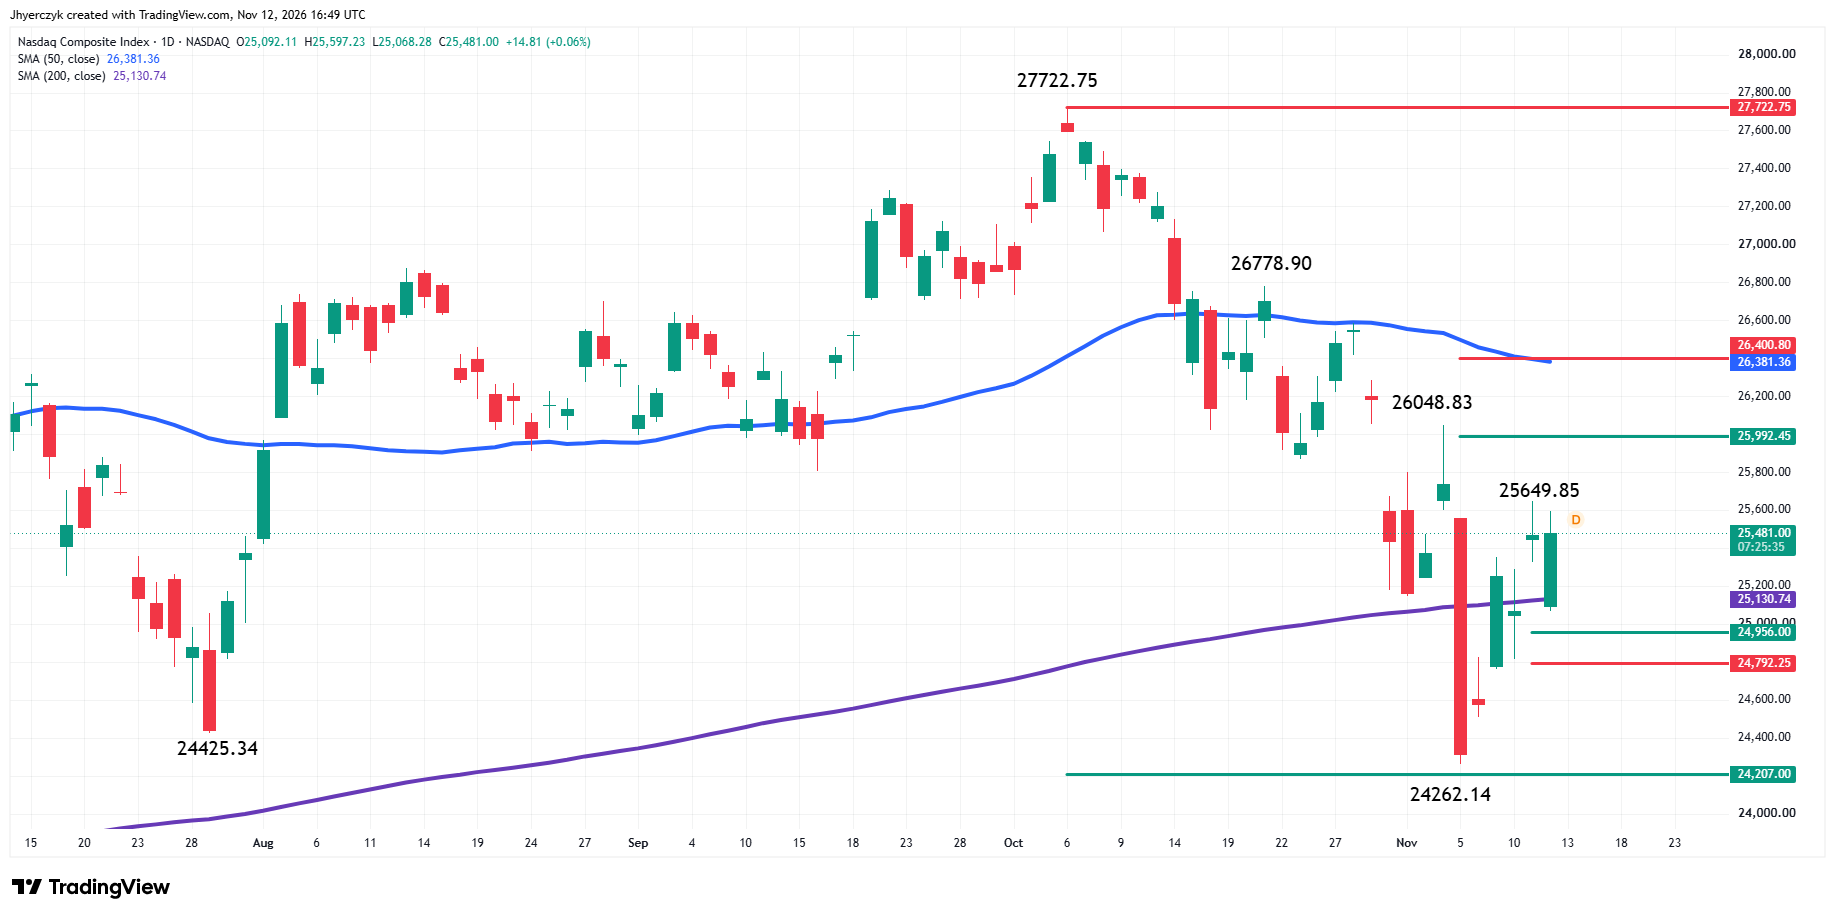
The Nasdaq Composite Index is trading slightly better on Thursday after recovering from earlier weakness. The main trend is down according to the daily swing chart. A trade through 26048.83 will change the main trend to up. Taking out 24262.14 will signal a resumption of the downtrend.
The minor trend is also down. A trade through 25649.85 will change the minor trend to up and shift momentum to the upside.
The key support is a short-term retracement zone at 24956.00 to 24792.25. The main upside target is the retracement zone at 25992.45 to 26400.80.
What to Watch
S&P 500 Index (SPX)
Despite the downtrend on the main swing chart, my bias is to the upside due to the intraday shift in momentum and the uptrending minor trend. My outlook will strengthen if buyers can overcome the 61.8% level at 7655.75 and the 50-day moving average at 7671.89. This move could trigger an acceleration to the upside with the main tops at 7715.57, 7758.43 and 7770.40 the primary upside targets. Taking out 7715.57 will change the main trend to up. A move through 7758.43 and 7770.40 will confirm the change.
A break back under the 50% level at 7597.44 will weaken my outlook and could even trigger a break under the minor bottom at 7550.84. If this occurs, my bias could even turn to the bearish side.
Nasdaq Composite Index (IXIC)
My bias shifted to the upside earlier today when buyers came in to support the index at the 200-day moving average at 25130.74. My outlook will strengthen if the minor top at 25649.85 is taken out. If this move increases the momentum then look for the rally to possibly extend into the retracement zone at 25992.45 to 26400.80. The 50-day moving average at 26381.36 will also become an upside target.
A failure to hold the 200-day moving average will shift my bias to the downside. My outlook will strengthen if the short-term retracement zone at 24956.00 to 24792.25 fails as support.
More Information in our Economic Calendar.