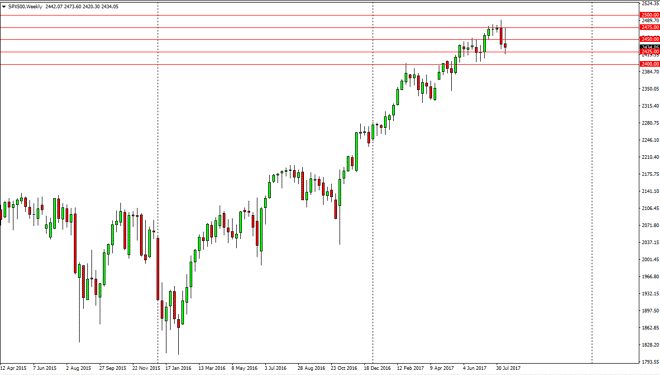
The S&P 500 initially tried to rally, but found enough resistance at the 2475 level to turn around and form a massive shooting star. The market fell
The S&P 500 initially tried to rally, but found enough resistance at the 2475 level to turn around and form a massive shooting star. The market fell as low as 2420 or so, so it looks very bearish to me. The 2400 level underneath is massive support, so if we were to break down below that level I think things could get rather ugly. Alternately, if we break above the top of the shooting star, then the market will probably make a move towards the 2500 level. Either way, it’s going to be a very choppy week, so keep that in mind. Small positions will probably be the best way to go going forward.
Chris is a proprietary trader with more than 20 years of experience across various markets, including currencies, indices and commodities. As a senior analyst at FXEmpire since the website’s early days, he offers readers advanced market perspectives to navigate today’s financial landscape with confidence.