The S&P 500 initially went sideways during the session on Friday, slicing through the 2425 handle at one point but turned around to show extreme
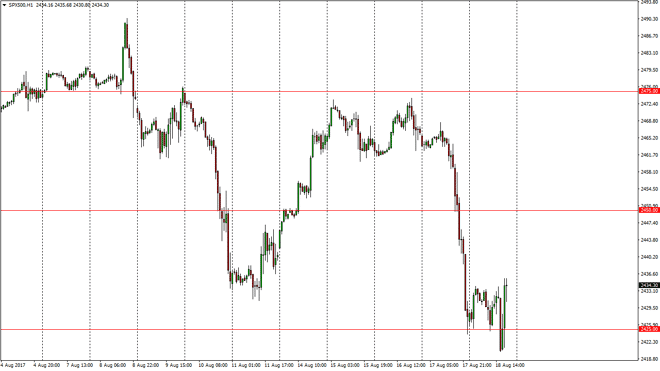
The S&P 500 initially went sideways during the session on Friday, slicing through the 2425 handle at one point but turned around to show extreme amounts of bullish pressure. Because of this, I believe that the S&P 500 is probably going to go reaching towards the 2450 handle. However, look at the weekly charts we had formed a shooting star that looks very negative and sits on a trend line. It will be interesting to see if this market can hang on to the gains, because if it will do so, I think that the 2425 level may become the new “floor” in the market. Expect choppiness nonetheless.
Chris is a proprietary trader with more than 20 years of experience across various markets, including currencies, indices and commodities. As a senior analyst at FXEmpire since the website’s early days, he offers readers advanced market perspectives to navigate today’s financial landscape with confidence.