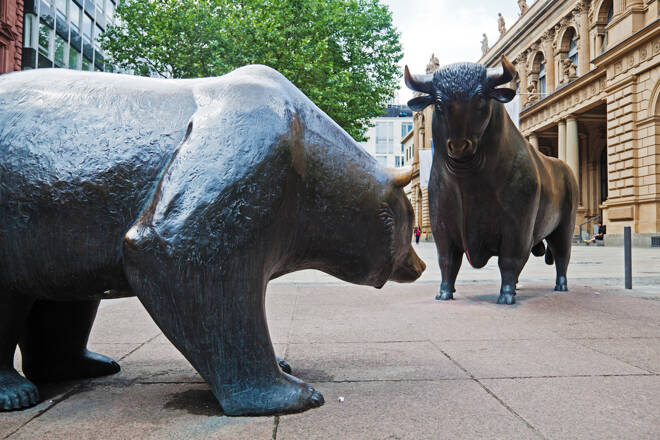
S&P 500 Set for ‘bear market’ – How Much Further Can US Stocks Fall?
By:
The S&P 500 is set to drop further when US markets open today, potentially marking a 5th session of losses over the past six.
This blue-chip index is down almost 18% from its record high set on January 3rd this year, almost meeting the threshold for a ‘bear market’.
What is a ‘bear market’?
A ‘bear market’ occurs when the price of an asset has fallen by at least 20% from its recent high.
Although it’s a seemingly arbitrary number (it doesn’t mean that US stocks will only fall by 20%), this traditional definition of a ‘bear market’ can be used as a sign that the US economy is headed for trouble (though not always a recession).
What is the S&P 500?
The S&P 500 is an index which measures the overall performance of US stock markets.
This index comprises 500 large companies that are leaders in their respective sectors such as IT, banks, healthcare, industrials, and real estate.
Hence, the S&P 500 is often used as a barometer for the US economy.
And in recent months, the S&P 500 has been pointing south.
Why are US stocks falling?
The primary reason for the sheer drop in stocks is because the US Federal Reserve (and other central banks around the world) is raising interest rates and reducing their balance sheet.
The Fed is doing this because US inflation is staying stubbornly elevated, around its highest levels in 40 years!
Last month, the US consumer price index, which is used to measure the changes in prices that consumers pay for goods and services, rose by 8.3% compared to April 2021. Back in March, the CPI grew by 8.5% compared to the same month last year (year-on-year).
In order to help bring these consumer prices down, the Fed is trying to “destroy” some of the demand in the economy.
When interest rates rise …
= more money is sucked out of the economy
(e.g. a borrower needs more money to pay higher interest on existing loans. The money used for those higher interest payments could’ve been spent on other goods or services).
= businesses earn less income (due to less spending in the economy)
= businesses may eventually be forced to lower its prices to meet the lower demand for its goods and services
= lower inflation (consumer prices still rise, but no longer at such as steep pace)
Also, in order for a business to survive, sometime it has to lower costs by paying less for workers’ salaries, or even reduce the number of staff employed. This can translate into either folks having less in disposable incomes, or even fewer people with incomes to spend.
Hence, the so-called “demand-destruction” that can help ease inflation back lower.
However, this task of slowing down inflation is far from straightforward, and can have massively negative consequences
The Federal Reserve thinks it can lower demand gently enough without causing a recession (a recession = when the economy shrinks).
Markets however are highly sceptical and are growing more fearful about the possibility of a recession, or at least a stagflation (when inflation remains high but the economy barely grows).
- Investors become less optimistic about the ability of US companies to generate profits over the near-term, if the economy were to become smaller by way of a recession.
- Hence, investors sell the shares in these companies, preferring to invest in something safer or set aside the cash to help weather the possible recession ahead.
How low can the S&P 500 go?
According to Bank of America analysts, there have been:
- 19 bear markets over the past 140 years
- each time, the S&P 500 averaged a drop of 37.3% from its peak
- the full drop happened over the course of 289 days
According to data from the S&P and Bloomberg, there have been
- 12 bear markets for the S&P 500 since World War 2
- average drop: 33.8% per bear market
- duration lasted anything from a month (during the pandemic) to 3 years (May 1946 – June 1949, after World War 2).
Using such measurements, that suggests that the S&P 500 could ultimately fall down to the 3,000 mark by October.
Such a drop would bring the S&P 500 back to levels not seen since June 2020!
Perhaps at this juncture, it’s apt to quote Bon Jovi in saying (or singing) “we’re halfway there”, and (US stocks are) “livin’ on a prayer.”
The good news is that US stocks tend to recover faster than the time it takes to see its full drop.
Still, between now and then, there could be a lot more pain in store for stock markets not just in the US, but also worldwide.
By Han Tan Chief Market Analyst at Exinity Group.
For a look at all of today’s economic events, check out our economic calendar.
About the Author
Han Tancontributor
A highly experienced financial journalist and producer with more than seven years of experience gained across some of Southeast Asia’s (SEA) most prominent business broadcasters.
Advertisement
