



The major stock indexes are putting in a mixed performance on Wednesday ahead of the Federal Reserve’s interest rate decision and policy statement. Traders will also get the opportunity to react to comments from Fed Chair Warsh in his press conference after the announcements. Traders want to know about the inflation outlook and the chances of a rate hike in December and beyond.
At 17:00 GMT, the Dow is trading 52541.27, up 163.70 or +0.31%. The S&P 500 Index is trading 7737.97, up 15.37 or +0.20% and the Nasdaq Composite is at 26464.812, down 12.999 or -0.05%.
The Fed is widely expected to keep interest rates unchanged at a target rate range of 3.75% to 4.00%. Traders don’t think this is a live meeting, which means no rate hike, but hawkish commentary from Warsh is expected to follow.
Chipmakers continued to advance on Wednesday, buoyed by record quarterly profit from SK Hynix. However, that didn’t translate into a positive performance by the Nasdaq with traders likely nervous about the Fed and key earnings reports from Alphabet and Microsoft after the close.
Daily S&P 500 Index (SPX) Technical Analysis
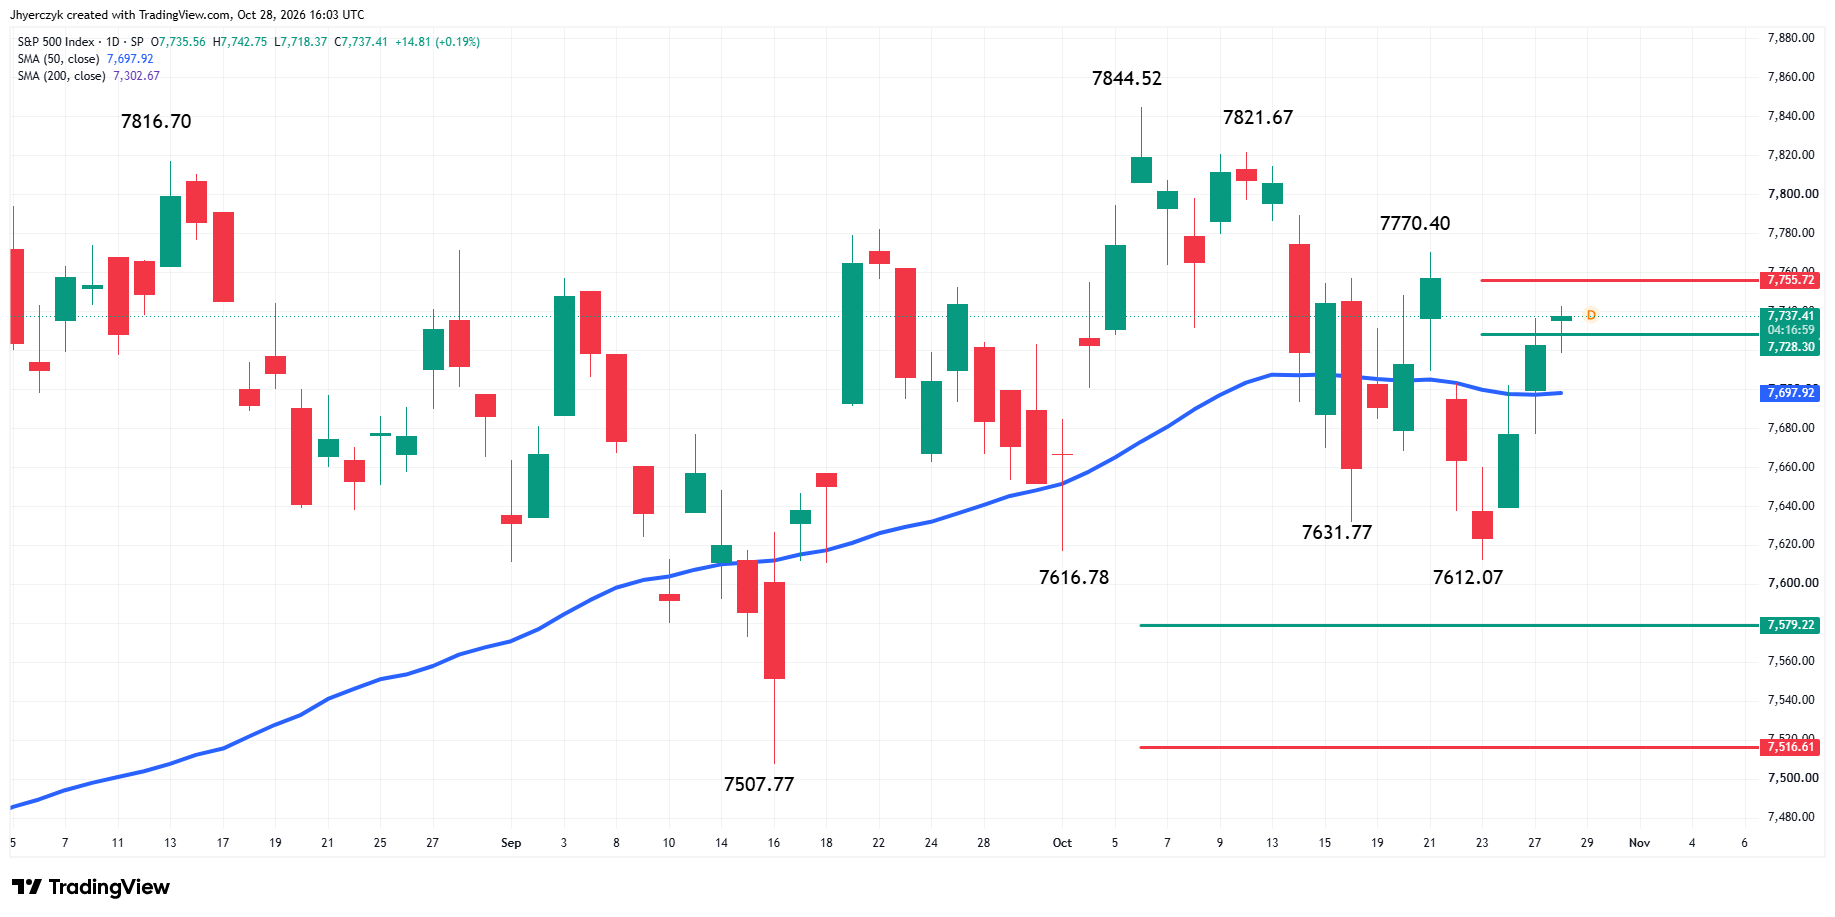
The S&P 500 Index is trading slightly better at the mid-session on Wednesday as traders await the Fed’s interest rate decision at 18:00 GMT. Today’s early strength is a follow-through move tied to yesterday’s breakout over the 50-day moving average.
The main trend is down according to the daily swing chart. A trade through 7770.40 will change the main trend to up. Taking out the swing bottom at 7612.07 will reaffirm the downtrend.
The short-term range is 7844.52 to 7612.07. The market is currently testing its retracement zone at 7728.30 to 7755.72. Trader reaction to this zone is likely to determine the near-term direction of the index.
Although the main trend is down, my bias has changed to the upside because of the shift in momentum on the move over the 50-day moving average at 7697.94. However, even this outlook faces challenges with the retracement zone at 7728.30 to 7755.72 standing in the way of a change in trend and potential breakout over the swing top at 7770.40.
My bias will shift back to the downside if the 50-day moving average fails to hold as support and momentum shifts back to the downside.
With the next major move seemingly hinging on the market’s reaction to the retracement zone at 7728.30 to 7755.72, traders should look for volatility until the market establishes its direction.
Dow Jones Price Forecast
Every new Dow Jones analysis as it publishes, today's technical signal and key levels, live price — on one page.
See all Dow Jones forecastsDaily Nasdaq Composite (IXIC) Technical Analysis
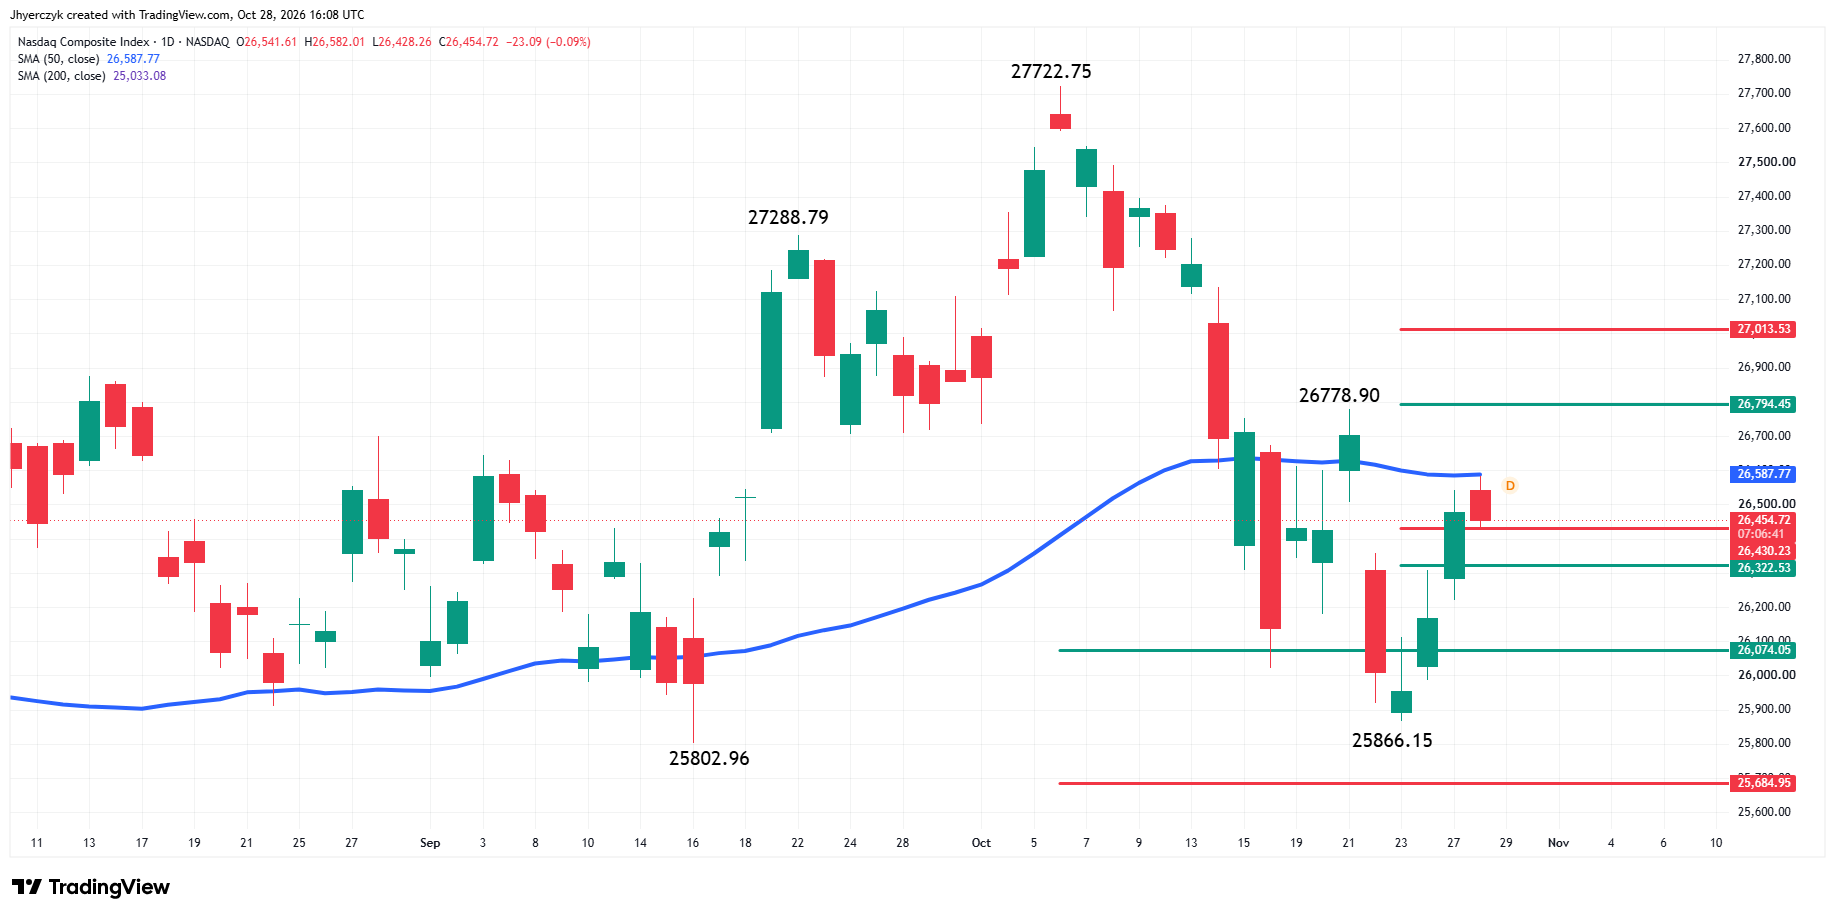
The Nasdaq Composite (IXIC) is trading lower at the mid-session on Wednesday. The market turned lower after giving back earlier gains following a test of the 50-day moving average.
The main trend is down according to the daily swing chart. A trade through 26778.90 will change the main trend to up. Taking out the swing bottom at 25866.15 will signal a resumption of the downtrend.
The rally started from inside the long-term retracement zone at 26074.05 to 25684.95 at 25866.15.
Today, it overtook the short-term retracement zone at 26322.53 to 26430.23. Traders may try to establish support inside this zone today if there is a further pullback.
The intermediate range is 27722.75 to 25866.15. If buyers can overtake the 50-day moving average at 26588.21 and the swing top at 26778.90 then look for the rally to possibly extend into the retracement zone at 26794.45 to 27013.53.
For the Nasdaq Composite, my bias is still to the downside because of the swing chart trend and the market’s relationship with the 50-day moving average at 26588.17. Overtaking this indicator will change my bias on expectations of a shift in momentum to the upside.
If momentum does increase then 26778.90 to 27013.53 will be my next target area. If sellers come in to defend the 50-day moving average then look for a stronger test of 26430.23 to 26322.53. If this area fails to hold then look for the selling to possibly extend into at least 26074.05.
Daily Dow Jones Industrial Average (DJI) Technical Analysis
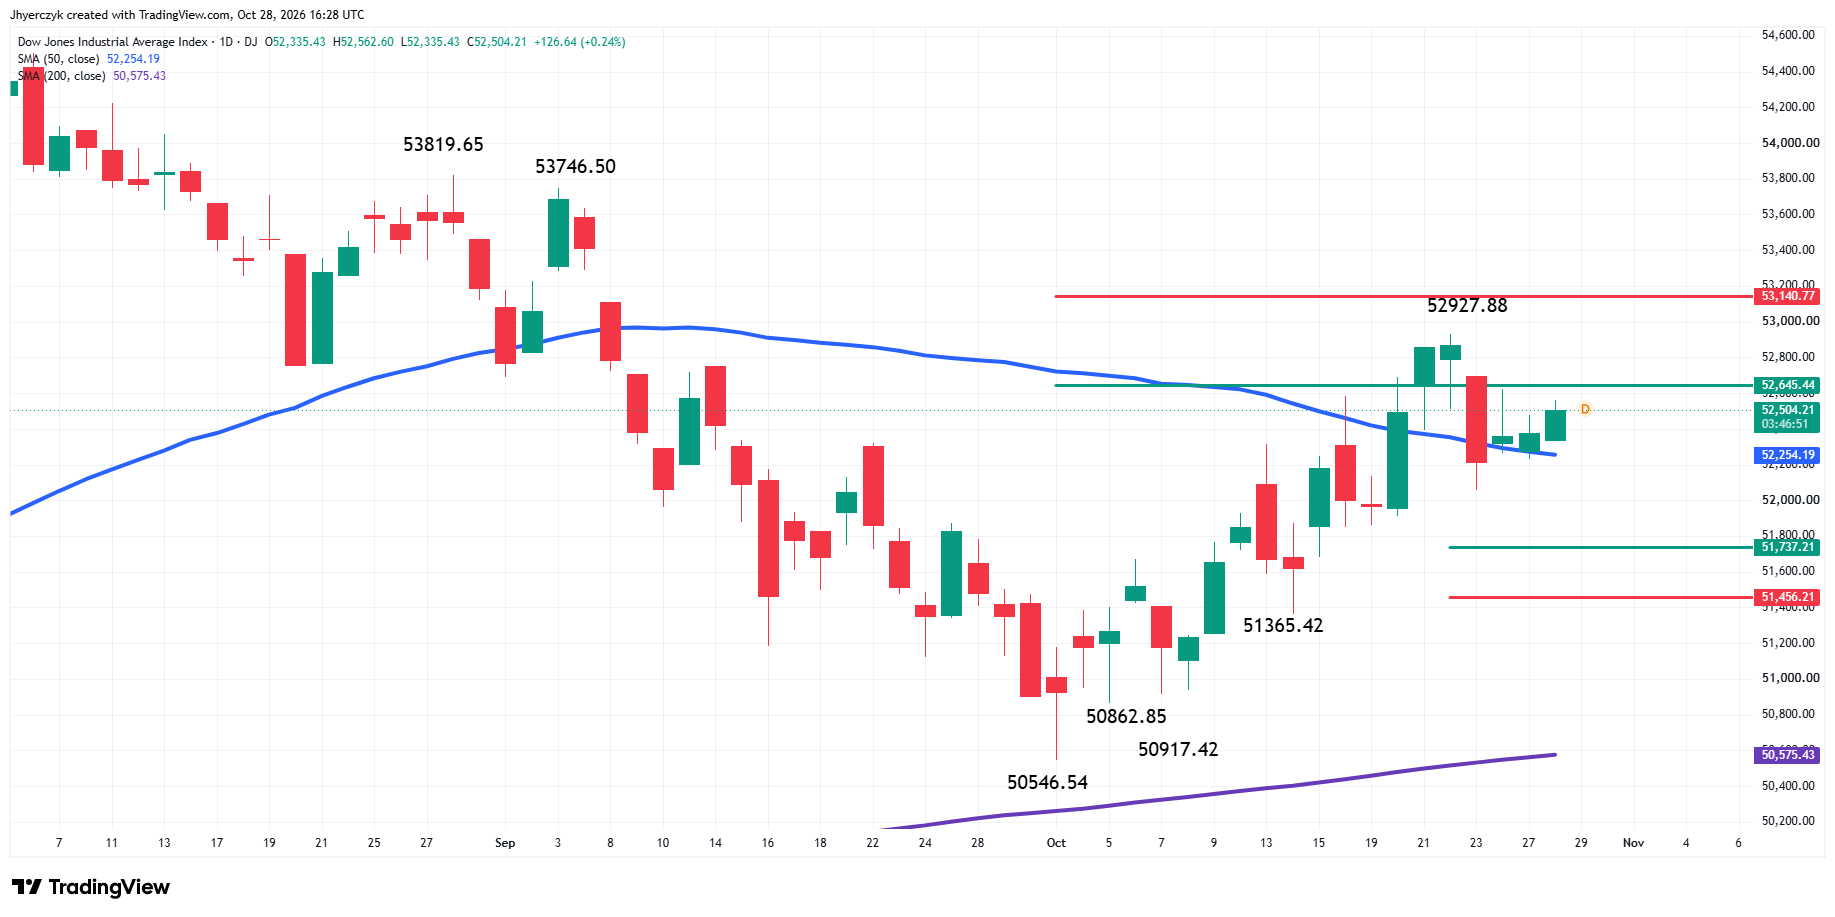
The Dow is higher on Wednesday but still trading inside Friday’s wide range. The main trend is up according to the daily swing chart. A trade through 52927.88 will reaffirm the uptrend. The main trend changes to down on a break through 51365.42.
The intermediate range is 54744.33 to 50546.54. Its retracement zone at 52645.44 to 53140.77 stopped the current rally at 52927.88 on Friday.
The short-term range is 50546.54 to 52927.88. If the selling pressure takes out the 50-day moving average then look for the move to possibly extend into its retracement zone at 51737.21 to 51456.21.
The Dow is trading on the strong side of the 50-day moving average and the main trend is up according to the daily swing chart. This is supporting my upside bias. It will weaken if the market crosses to the weak side of the 50-day moving average. If this occurs, momentum may shift to the downside and the Dow may correct into the short-term retracement zone at 51737.21 to 51456.21.
If buyers can overcome the 50% level at 52645.44 then momentum could increase again, with upside targets at the swing top at 52927.88 and the 61.8% level at 53140.77.
What to Watch
Daily S&P 500 Index
My bias is to the upside because the market crossed to the strong side of the 50-day moving average. However, the retracement zone at 7728.30 to 7755.72 is standing in the way of a change in trend to up.
A sustained move over 7755.72 could put the swing top at 7770.40 on the radar. If the 50-day moving average at 7697.94 fails as support, then my bias will shift back to the downside.
Daily Nasdaq Composite
My bias remains to the downside because of the swing chart trend and the market’s relationship with the 50-day moving average at 26588.17.
If buyers can overtake the 50-day moving average, then look for a challenge of 26778.90 and a possible extension into 26794.45 to 27013.53. If sellers defend the moving average, then the first downside test is 26430.23 to 26322.53. A failure to hold this zone could lead to 26074.05.
Daily Dow Jones Industrial Average
My bias is to the upside because the Dow is trading on the strong side of the 50-day moving average and the main trend is up.
Overcoming 52645.44 could trigger another test of 52927.88, followed by 53140.77. A break back under the 50-day moving average would weaken my outlook and could trigger a correction into 51737.21 to 51456.21.
More Information in our Economic Calendar.