AI Names Are Lifting the Indices While Most Sectors Are Lower
Seven of 11 S&P 500 sectors are lower at the mid-session Friday. Declining stocks outnumber advancing stocks on both the NYSE and Nasdaq. The indices are green anyway.
Microsoft is up more than 3% after adding new Copilot capabilities. Akamai is up more than 7% on an $11.6 billion cloud-services agreement with Anthropic. Qualcomm and Dell are higher.
The Nasdaq Composite Index has 34 new 52-week highs and 123 new lows. The S&P 500 Index has 3 new highs and 30 new lows. The stock-level tape is divided. The index tape is not.
At 16:16 GMT, the Dow Jones Industrial Average is trading 51,761.13, up 411.15 or 0.80%. The Nasdaq Composite Index is trading 27,074.69, up 135.32 or 0.50%. The S&P 500 Index is trading 7,744.91, up 40.78 or 0.53%.

Lower Oil Helped the Tape but Yields and Inflation Expectations Did Not
November WTI crude oil futures fell near $92 per barrel Friday. November Brent crude oil futures eased toward $104 as traders revisited the possibility of a U.S.-Iran agreement tied to reopening the Strait of Hormuz. The headline lowered some energy-risk premium. It did not reopen the Strait or restore normal tanker traffic.
The 10-year Treasury yield is near 5.19% after reaching its highest since 2007 Thursday. The 30-year is near 5.49%. Fed funds futures are carrying about a 66% chance of another October rate hike. The yield market backed off its highs. It has not reversed.
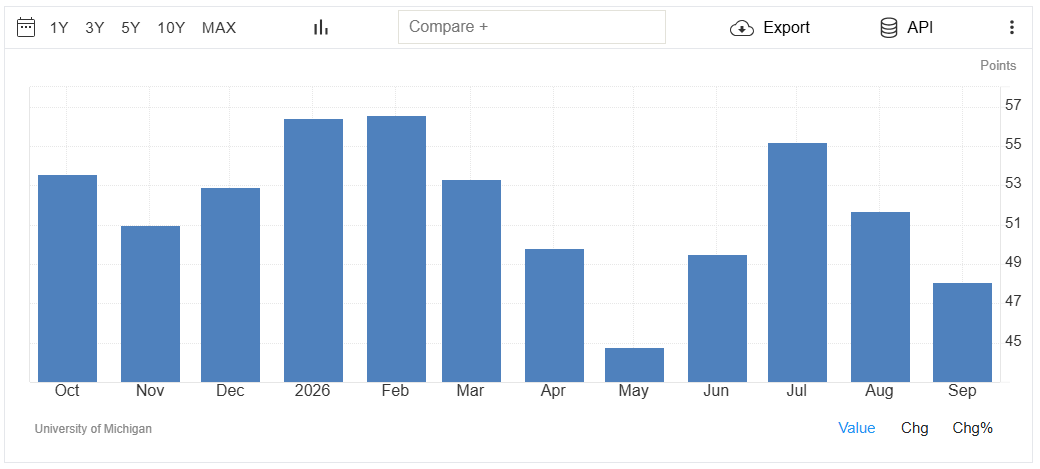
The University of Michigan’s final September consumer-sentiment reading came in at 48.1, slightly above estimates but down 7% from August. One-year inflation expectations rose to 4.6%, the highest since June. Consumers weaker and inflation expectations higher on the same report. That is not a clean reason for the bond market to back down.
Durable-goods data showed AI-related capital-goods demand holding up. The spending side of the economy is strong enough to support the AI trade. It is also strong enough to keep the Fed argument alive.
Dow Jones Price Forecast
Every new Dow Jones analysis as it publishes, today's technical signal and key levels, live price — on one page.
See all Dow Jones forecastsThe AI Trade Is Holding the Indices Together for the Week
The Nasdaq Composite Index is up nearly 2% for the week. The S&P 500 Index is up about 1%. The Dow Jones Industrial Average is slightly lower and headed for a fourth consecutive weekly loss.
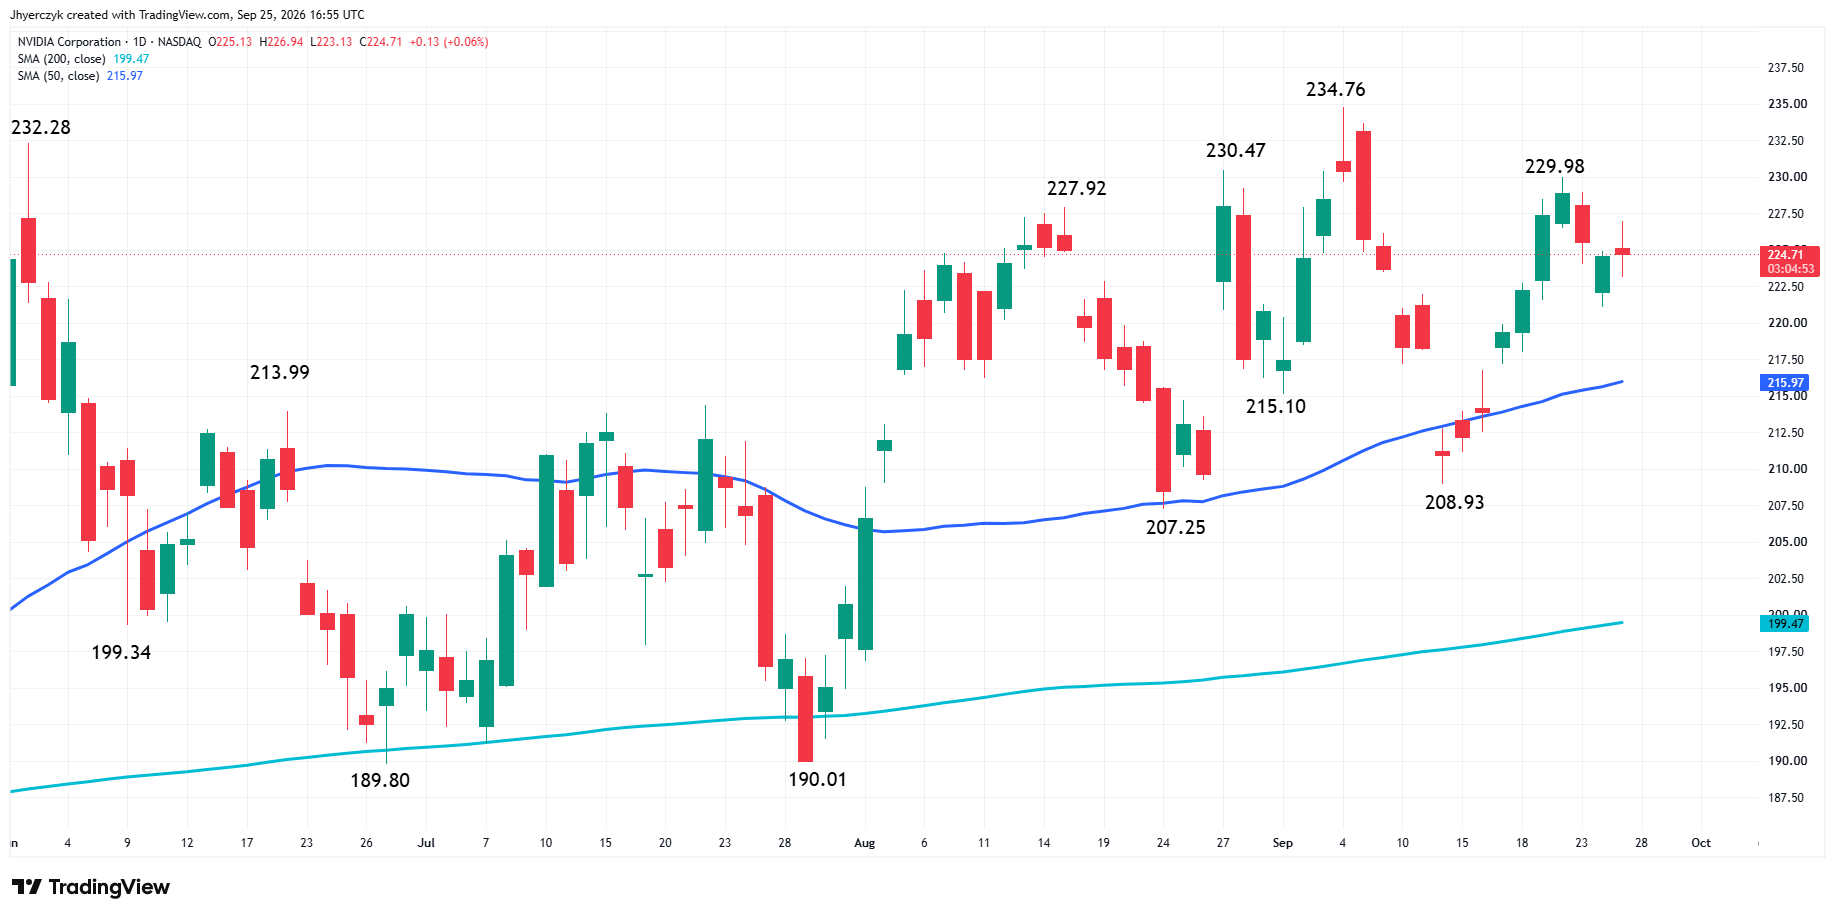
Microsoft, Qualcomm, Dell, Nvidia, and Akamai are not trading the same story as every other technology name. Meta is down 2.68%. Palo Alto Networks is down 3.19%. Coinbase is down 2.31%. Buyers are staying with companies that have a direct link to AI software, cloud capacity, chips, and equipment. The rest of technology is not getting the same bid.
The technology sector is up about 0.8% Friday, offsetting weakness across most of the S&P 500 Index. That has been the pattern all week. A narrow group of AI infrastructure names keeps the indices supported while the Dow, rate-sensitive stocks, and energy give ground.
Daily Dow Jones Industrial Average Technical Analysis
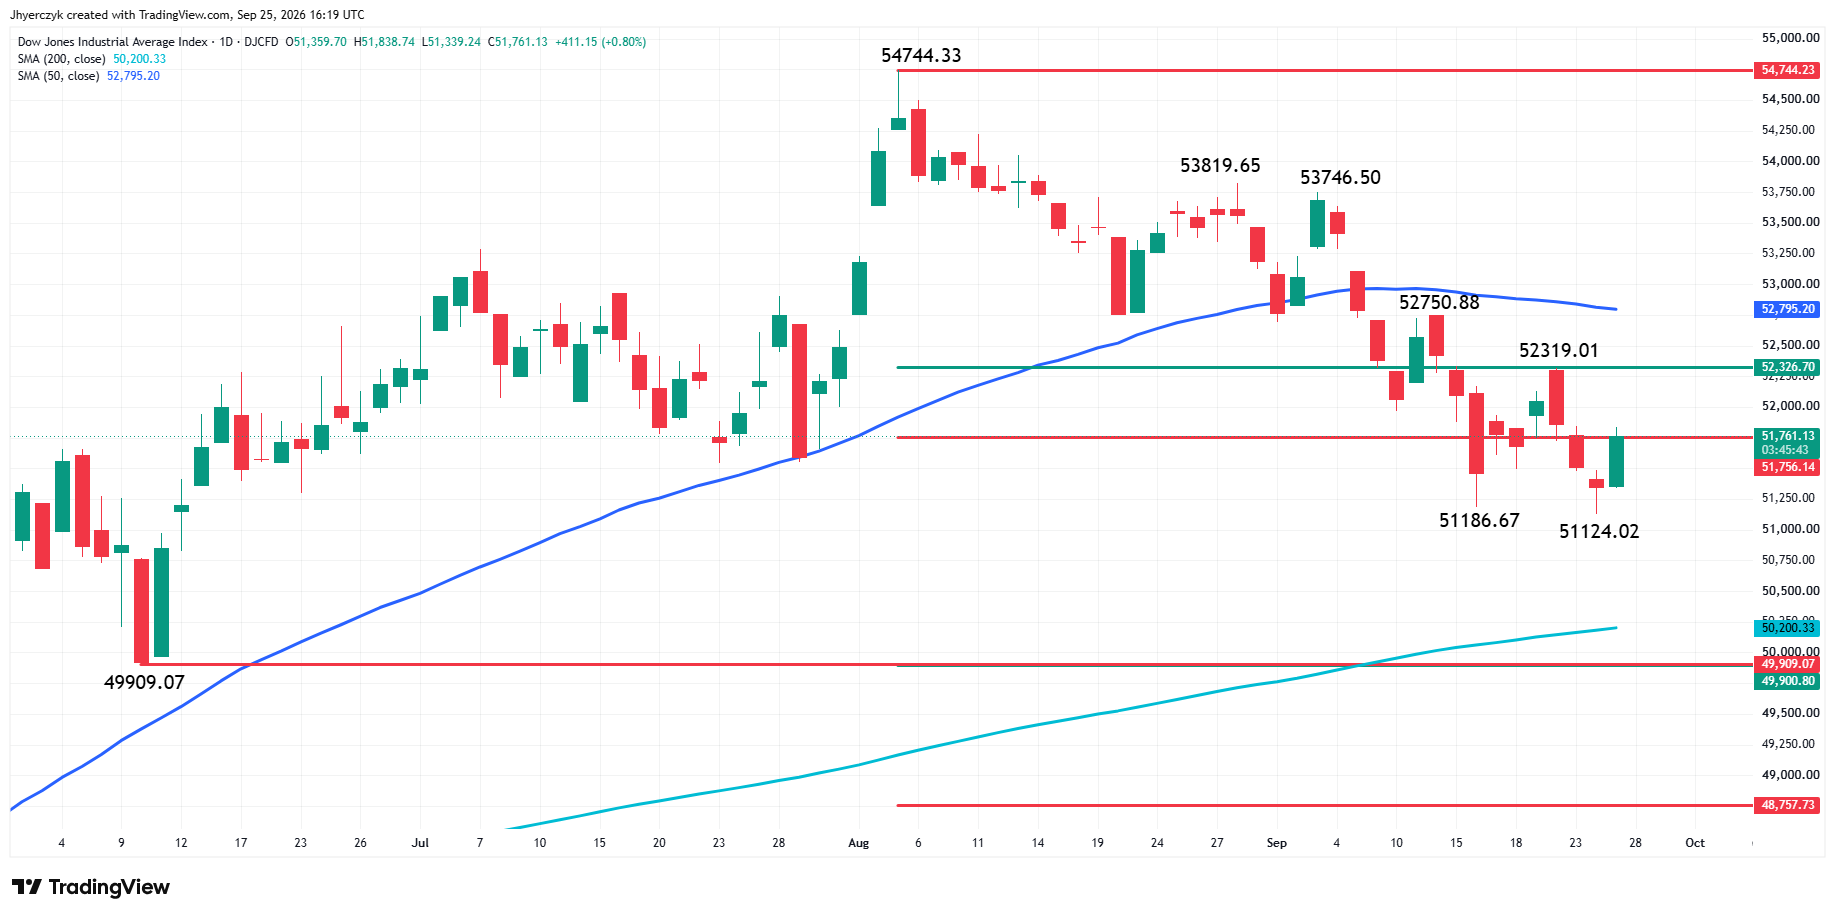
The Dow Jones Industrial Average is recovering from Thursday’s low at 51,124.02 and testing the 50% level at 51,754.13. A sustained move over this level could extend the recovery into the 52,319.01 minor top.
The main trend is down according to the daily swing chart. A trade through 53,746.50 will change the main trend to up. A break through 51,124.02 will signal a resumption of the downtrend.
The 50-day moving average at 52,795.20 is the next major resistance area if buyers keep pressing. Failure to hold above 51,754.13 would weaken the current recovery and put the recent low back on the chart.
Daily Nasdaq Composite Technical Analysis
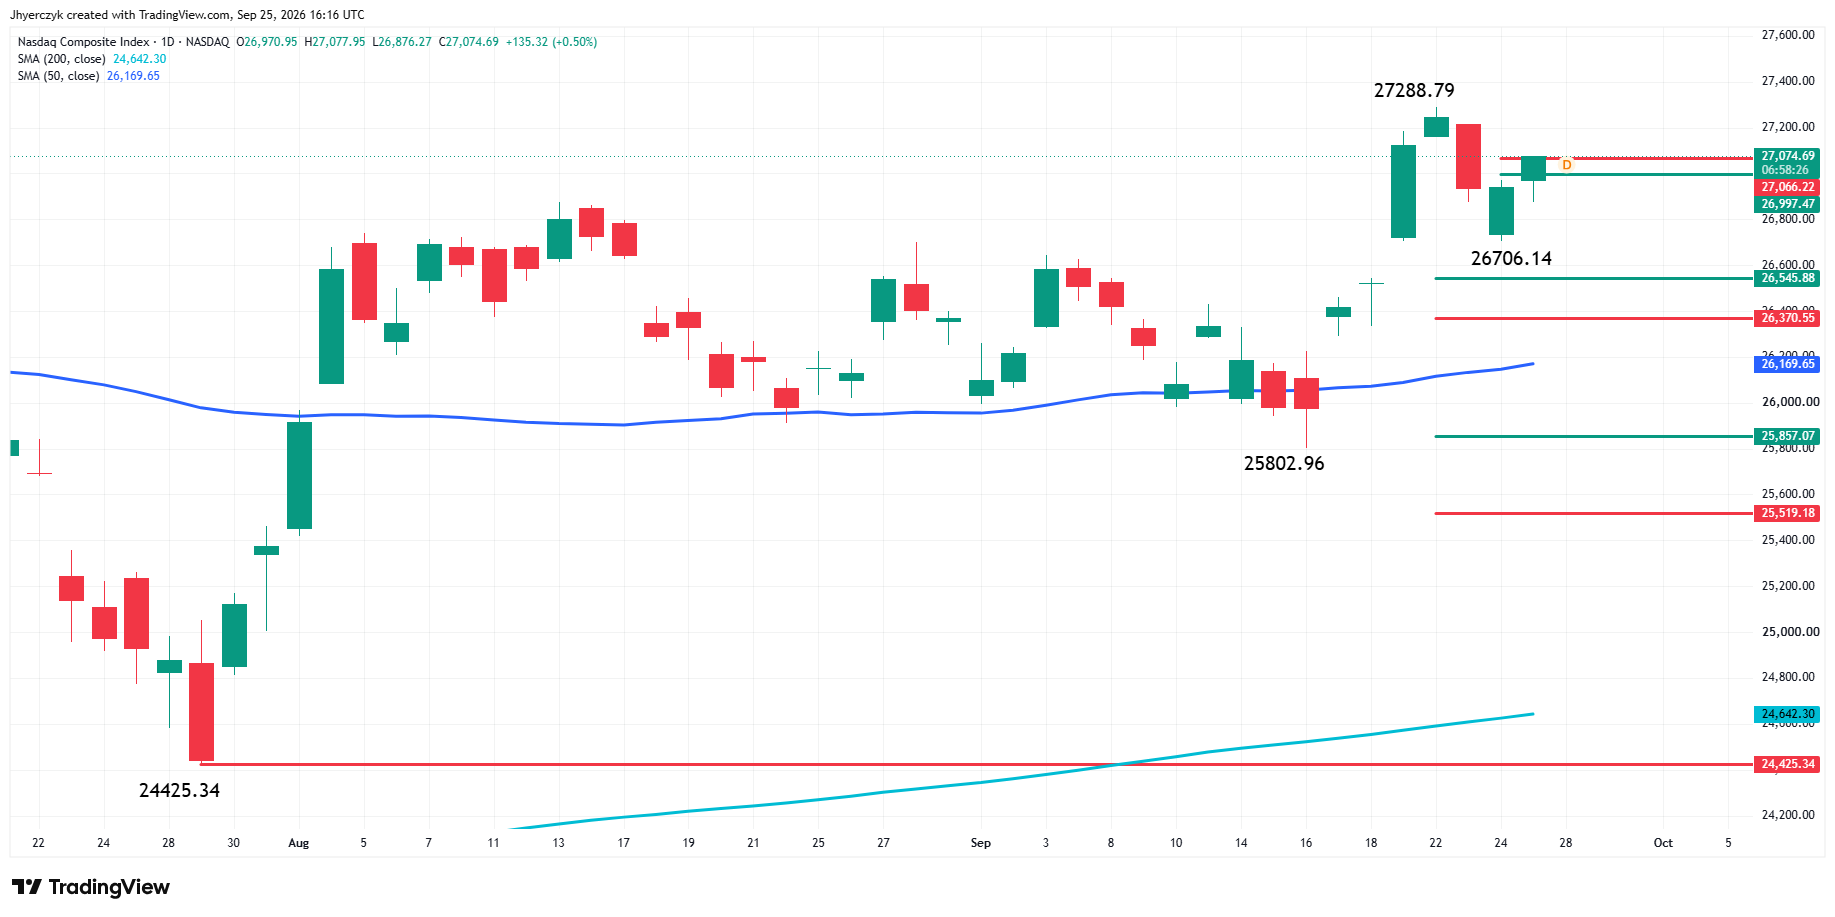
The Nasdaq Composite is trading above the 26,997.47 to 27,066.22 retracement zone after Thursday’s break. Holding above the zone would signal that buyers are taking control of the recovery.
A sustained move over 27,066.22 puts the 27,288.79 main top back in play. A trade through that level will reaffirm the uptrend.
The main trend is up. A break through 25,802.96 will change the main trend to down. If the Nasdaq falls back under 26,997.47, then the recent bottom at 26,706.14 becomes the first downside target.
Daily S&P 500 Technical Analysis
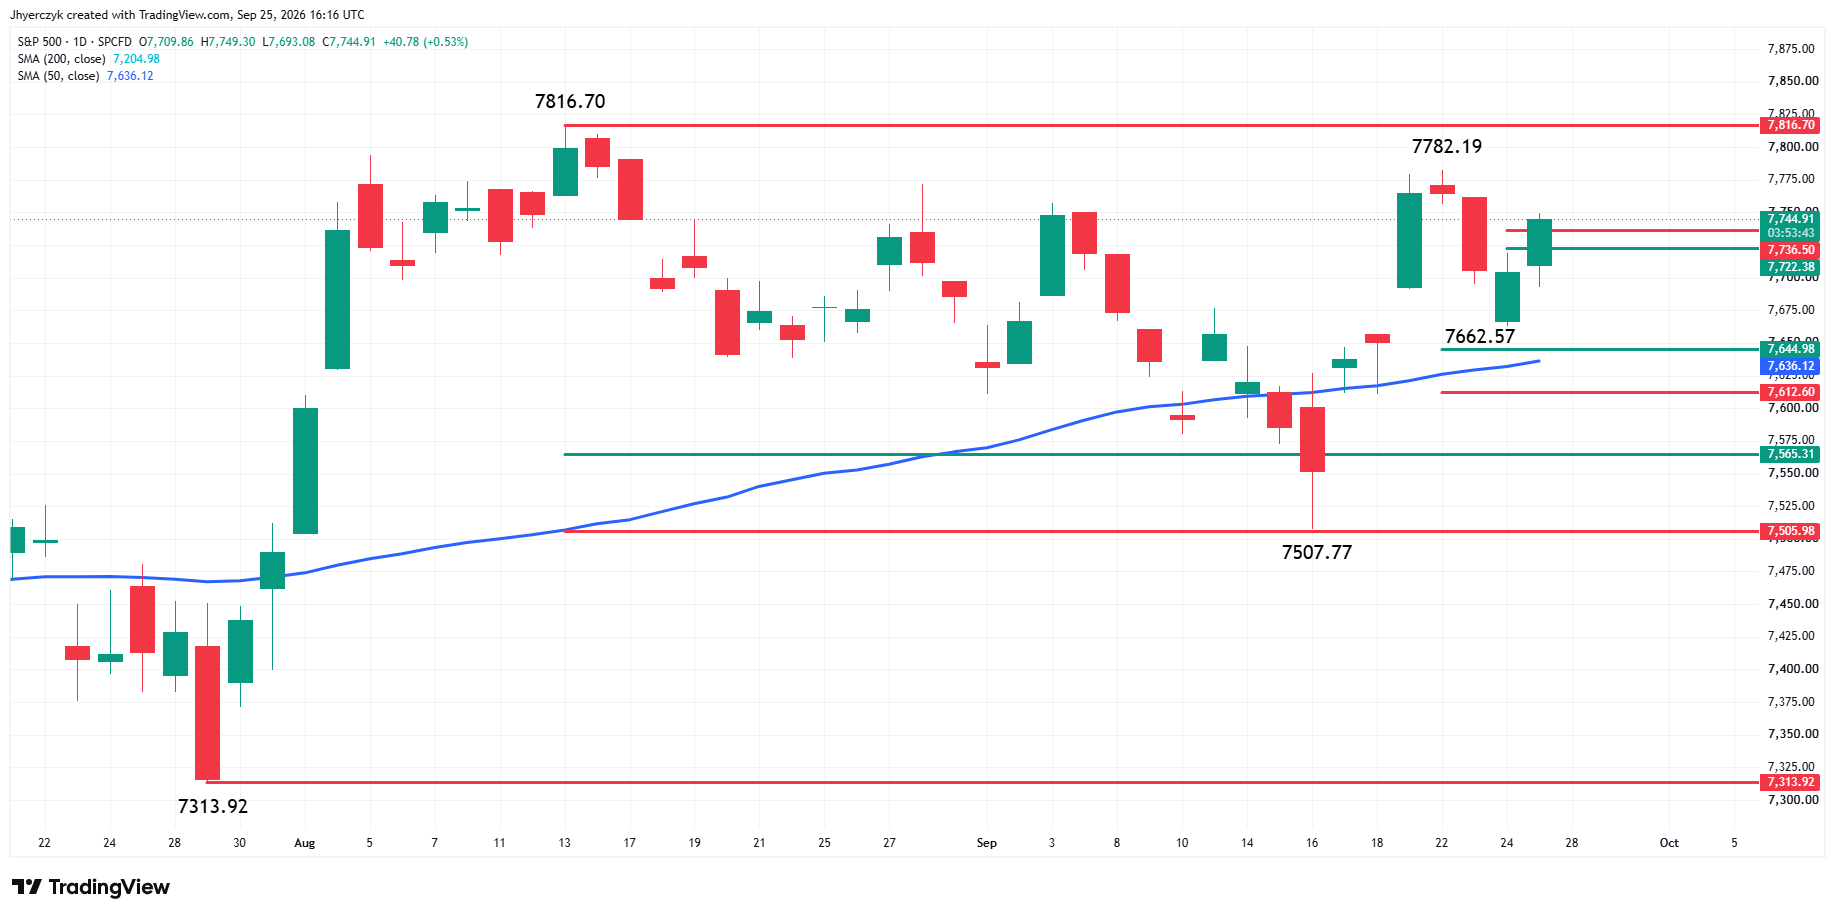
TheS&P 500 Index is trading above the 7,722.38 to 7,736.50 retracement zone after bouncing from Thursday’s low at 7,662.57. Holding above the zone gives buyers a chance to work on the 7,782.19 minor top.
A sustained move through 7,782.19 would put the 7,816.70 main top back in play. The main trend remains up. A move through 7,507.77 will change it to down.
A failure to hold 7,736.50 would put Thursday’s low back on the chart. Below that, the 7,644.98 to 7,612.60 support zone is the next area to watch, with the 50-day moving average at 7,636.12 inside it.
What to Watch
The AI infrastructure bid is carrying the indices through a session where most sectors are red. Lower oil is helping sentiment but the Strait of Hormuz story is still a negotiation, not a normalized shipping lane. Consumer sentiment fell 7% from August and one-year inflation expectations reached their highest since June. The 10-year is near 5.19% with October hike odds at 66%.
The Dow is testing 51,754.13. The Nasdaq Composite Index is holding above 27,066.22. The S&P 500 Index is above 7,736.50. The week ends with the Nasdaq up nearly 2% and the Dow headed for a fourth straight loss. The concentration is the story. The AI names are keeping the indices up. The bond market has not given the rest of the tape room to join them.
More Information in our Economic Calendar.