



Major U.S. stock indexes were mixed on Friday as Thursday’s technology selloff spread into sectors that had been attracting defensive money. The split between the indexes is important. The Nasdaq is getting support from buyers willing to take offers in a few chip names after Thursday’s break. The Dow is feeling the broader pressure with the selling moving into consumer staples, utilities, healthcare and other groups that traders had been using for protection.
The Dow Jones Industrial Average was down 513 points, or 1%. The S&P 500 Index was lower by 0.1%, while the Nasdaq Composite was up 0.3%, supported by gains in selected semiconductor shares.
Defensive Rotation Is Losing Support
For much of the past two weeks, traders had been moving out of data-center and technology stocks and into defensive sectors. That may have been the right move as investors worried about the amount of debt and capital spending tied to the AI build-out.
Friday’s price action, however, suggests the defensive stock rotation may be losing support. Defensive sectors are lower, with the Dow taking the largest loss among the major indexes. What this does not mean is that investors have once again turned bullish on technology. What it likely means is that investors are becoming less willing to hold the groups that were supposed to cushion a technology selloff.
The S&P 500 is holding closer to unchanged because the broad market still has enough buyers to offset some of the Dow weakness. However, the pressure in defensive sectors is a warning that the selling could spread if the technology bid fails to hold.
Technology Buyers Are Being Selective
The strength in selected chip stocks is helping the Nasdaq. However, it is not making the financing issue that hurt the group on Thursday go away. Traders remain concerned about the amount of money needed to build data centers. Furthermore, there are worries over whether companies can keep funding those projects without increasing pressure on the credit markets.
Dow Jones Price Forecast
Every new Dow Jones analysis as it publishes, today's technical signal and key levels, live price — on one page.
See all Dow Jones forecastsThe current buying is concentrated in companies traders believe have visible demand. That is different from broad buying across the technology sector. Investors are being selective. They are separating the companies showing revenue opportunities from the companies carrying the largest financing questions.
Daily S&P 500 Index (SPX) Technical Analysis
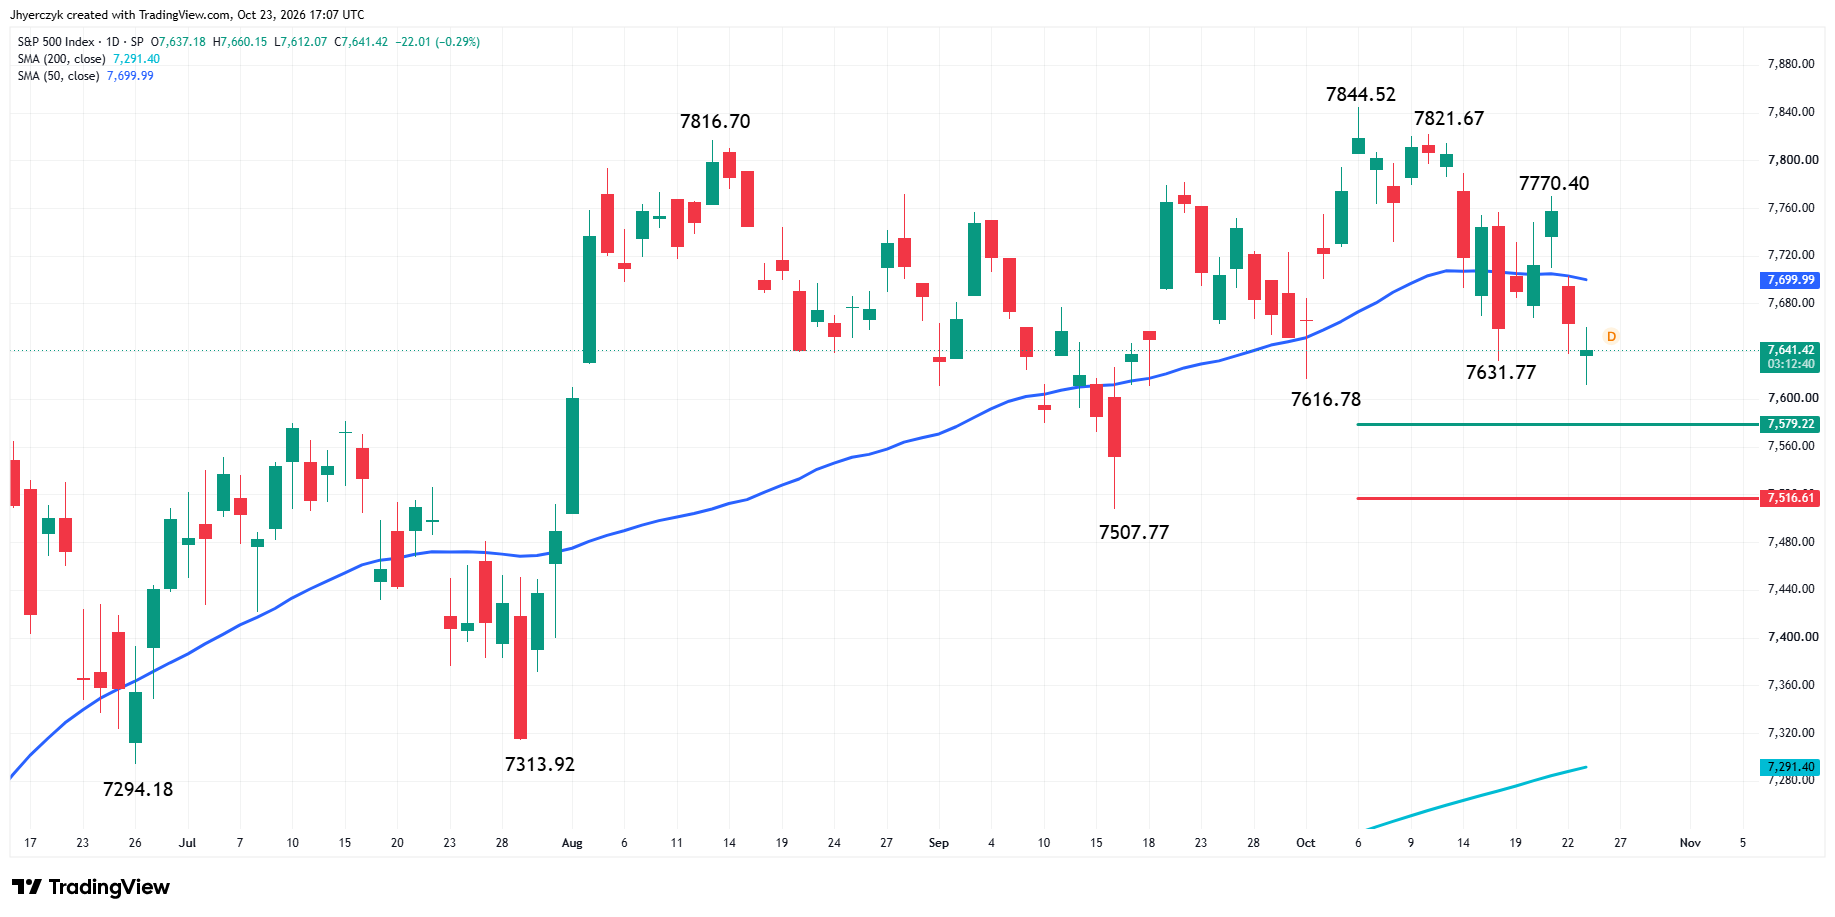
The S&P 500 Index is edging lower on Friday after taking out another swing bottom earlier in the session. The main trend is down according to the daily swing chart. The trade through 7,631.77 reaffirmed the downtrend. The main trend will change to up on a move through 7,821.67. This will be reaffirmed by a breakout over 7,844.52 to a new record high. The trade through 7,616.78 also reaffirmed the downtrend.
The minor trend is also down. A trade through 7,770.40 will change the minor trend to up.
The index is also on the weak side of the 50-day moving average at 7,700.01, making it resistance. This indicator is essentially controlling the momentum while the index is trading below it.
The late July to early October range is 7,313.92 to 7,844.52. Its retracement zone at 7,579.22 to 7,516.61 is the next major downside target zone. We could see a counter-trend bounce on the first test of this area especially since it is directly in front of the major swing bottom at 7,507.77. The swing bottom is a potential trigger point for an acceleration into 7,313.92 and the 200-day moving average at 7,291.41.
Daily Nasdaq Composite (IXIC) Technical Analysis
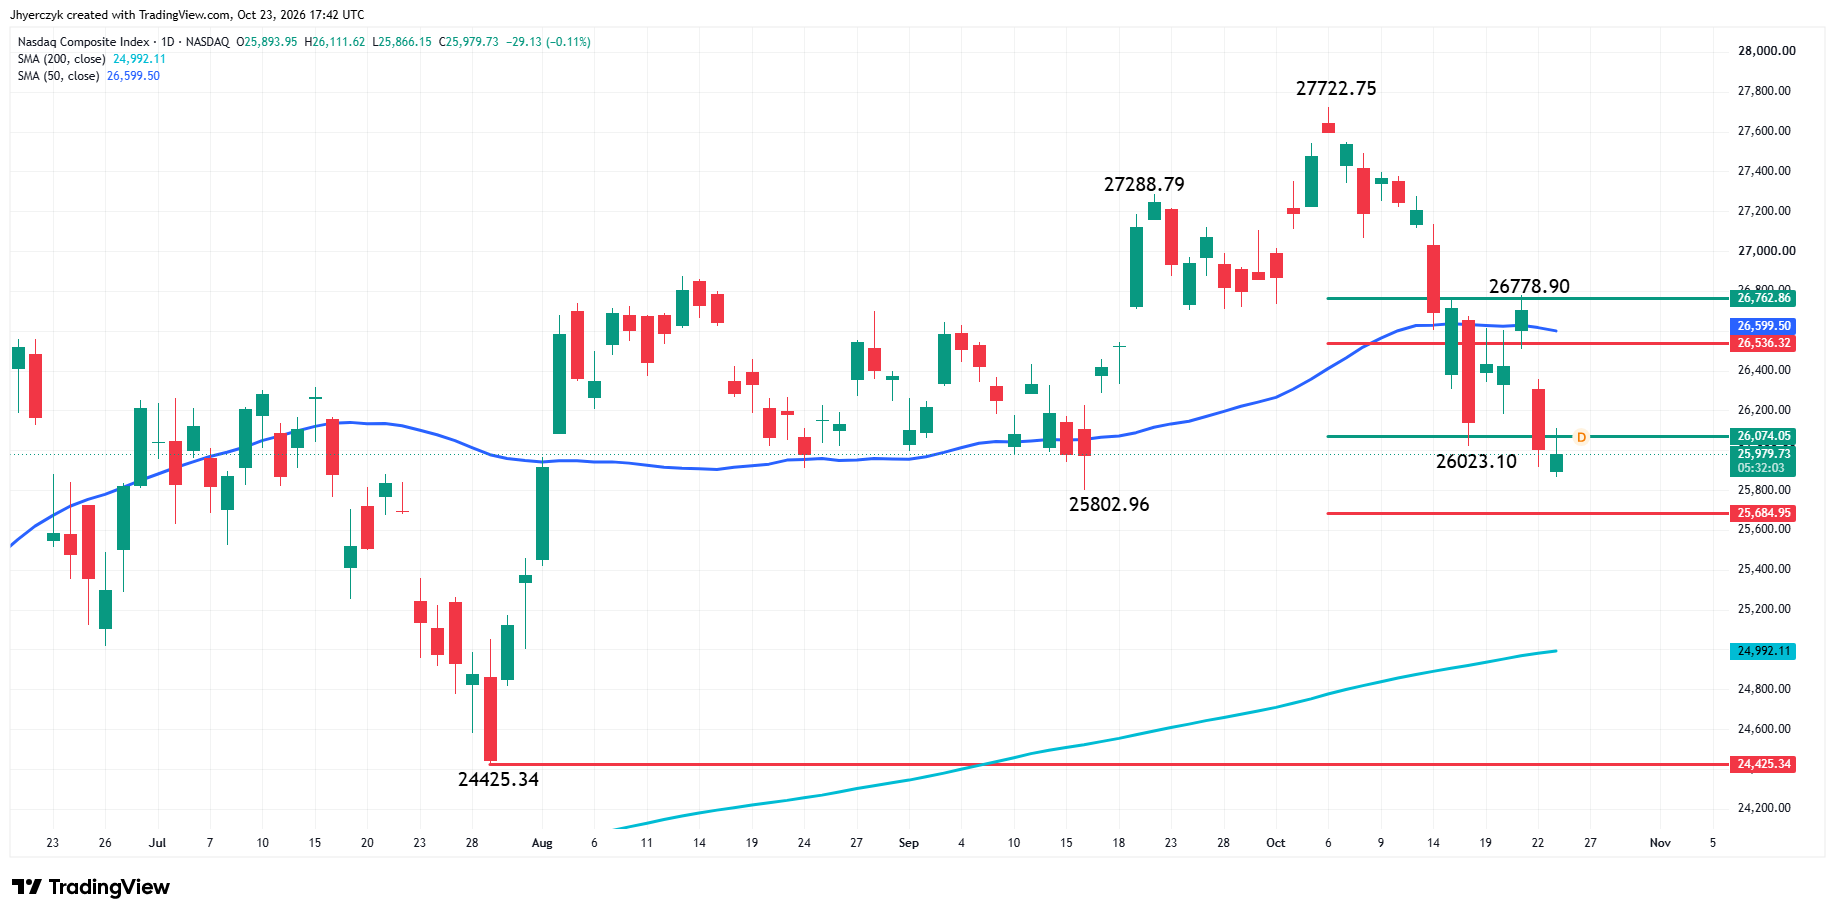
The Nasdaq Composite is lower late in the session on Friday. The main trend is down according to the daily swing chart and the index opened the session on the weak side of the 50-day moving average at 26599.51.
The downtrend resumed on Friday when sellers took out yesterday’s low at 25918.09. It will be reaffirmed on a trade through the September 16 main bottom at 25802.96. The main trend will change back to up if buyers can take out 27722.75.
The minor trend is also down. A trade through 26778.90 will change the minor trend to up and shift momentum to the upside.
Retracement zone resistance is 26536.32 to 26762.86. Inside this zone is the 50-day moving average at 26599.51. This is solidifying its importance as a key resistance area.
Retracement zone support at 26074.05 to 25684.95 is currently being tested. Inside this zone is the main swing bottom at 25802.96. Traders should watch this area for a technical bounce and the possible start of a counter-trend rally.
What to Watch
For the S&P 500 Index, I have a bias to the downside because the main trend is down on the swing chart. It’s also being supported by the trade on the bearish side of the 50-day moving average. Conditions could change after a successful test of 7,579.22 to 7,516.61 that could alter my outlook. Furthermore, my outlook will weaken if the 50-day moving average is recaptured.
My bias for the Nasdaq Composite is also to the downside. Not only is the swing chart trending lower, but the index is also trading on the weak side of the 50-day moving average. The index is currently testing a critical retracement area that is likely to determine the near-term direction of the market.
A move over the 50% area at 26074.05 and we could see a counter-trend rally back to the 50-day moving average at 26599.51. Break sharply through the 61.8% retracement level at 25684.95 and the index could collapse into the 200-day moving average at 24992.15.
More Information in our Economic Calendar.