
Advertisement
Advertisement
Technical Checks For US Dollar Index, Dow Jones And S&P500: 28.04.2017
By:
US Dollar Index Ever since the early-week result of French election dragged US Dollar Index to break eight-month old ascending trend-line, the greenback
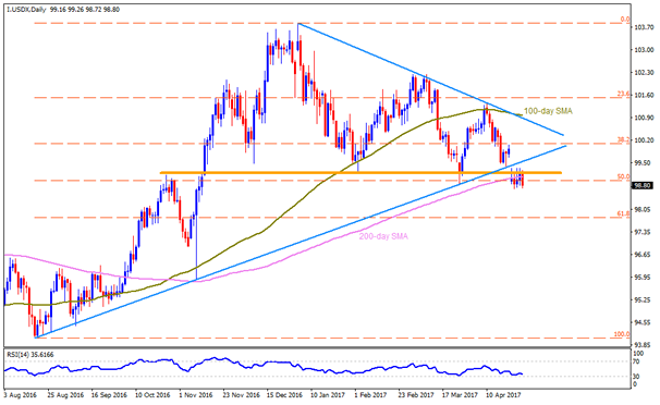
US Dollar Index [I.USDX]
Ever since the early-week result of French election dragged US Dollar Index [I.USDX] to break eight-month old ascending trend-line, the greenback gauge continued trading in a small range of 98.70 – 99.30. However, today being the US GDP announcement, the index has been trading southward within the range since morning and a break of 98.70, backed by weak growth figure, can further fetch the quote to 98.45 and then to 98.15 before flashing 98.00 on the chart. Given the numbers maintain its south-run after clearing 98.00, it becomes wise to expect 97.45, 97.25 & 96.90 figures to please Bears. Meanwhile, a surprisingly optimistic GDP may propel the gauge to 99.30, breaking which 99.60 and the 100.00 psychological magnet could entertain short-term Bulls while 100.40-45 and the 100.80 are likely following resistances to observe. In case if the greenback index continue rising beyond 100.80, the 100.95 – 101.00 resistance-confluence, comprising 100-day SMA & descending trend-line, might restrict its further advances.
Dow Jones Industrial Average [DJI30]
Even if the French election result wasn’t good news for the US Dollar Index, equity markets welcomed it with sharp rally and follow-on upbeat corporate results have been helping one of the most famous US equity index, Dow Jones. However, 21025-30 horizontal-line seems acting as a barrier during the gauge’s rally to challenge 21100 and the March month high around 21170. Should the index successfully clear 21170, it becomes capable enough to aim for 61.8% FE level of 21320. On the contrary, 20890, 20840, 20770 and the 50-day SMA level of 20758 are expected nearby supports to look during the pullback by the index, which if cleared gives rise to probabilities of witnessing 20650-45 again as a quote.
S&P 500 [SP500]
Unlike DJI30, the S&P500 is already rising towards March high of 2401 and is more likely to surpass the same should US growth figures please buyers. As a result, the gauge’s follow-on rally to 61.8% FE level of 2425 and then to the 2450 bears high chances of occurrence. Moreover, Bulls dominance over the prices beyond 2450 might not restrict the index from flashing 2500 mark. Alternatively, 2381 & 2369 may please countertrend traders before the 50-day SMA number of 2362 gains importance. If the gauge closes below 2362, chances of its drop to 2335 can’t be denied.
Cheers and Safe Trading,
Anil Panchal
About the Author
Anil Panchalauthor
An MBA (Finance) degree holder with more than five years of experience in tracking the global Forex market. His expertise lies in fundamental analysis but he does not give up on technical aspects in order to identify profitable trade opportunities.


Advertisement