
Advertisement
Advertisement
Technical Outlook: EURCAD, GBPCAD, CADJPY and CADCHF
By:
EURCAD Following its failure to sustain 1.5550-60 break, the EURCAD plunged to 38.2% Fibonacci Retracement of its April – August advance; though, a bounce
EURCAD
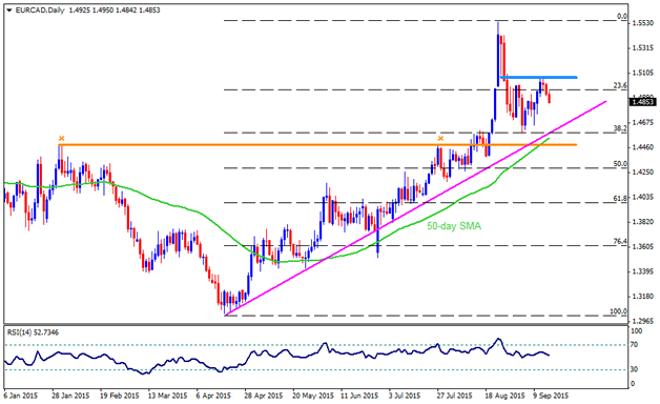
Following its failure to sustain 1.5550-60 break, the EURCAD plunged to 38.2% Fibonacci Retracement of its April – August advance; though, a bounce from the same seems currently being restricted by the 1.5060-80 horizontal resistance, signaling the pair’s continued pullback towards the mentioned Fibo, near 1.4585-80 area that also encompasses five month old ascending trend-line support. However, a break of 1.4580 is likely to be followed by the 50-day SMA, near 1.4550, and a year old horizontal resistance-turned-support, near 1.4500 – 1.4490 area. Given the pair’s ability to break 1.4490 on a closing basis, it becomes vulnerable to plunge towards 1.4100 area with 50% Fibo, at 1.4280, being intermediate rest. On the upside, 1.4950, representing 23.6% Fibo, followed by the 1.5060-80 horizontal region, could limit near-term advance by the pair while a sustained break of 1.5080 can fuel the pair’s upward trajectory towards 1.5400 area prior to targeting the August highs near 1.5550-60 resistance-zone.
GBPCAD
Ever since the GBPCAD broke above its 50-day SMA, during later May, it managed to extend the upward trajectory towards the highest level in nearly eight years; however, a pullback from the same 2.0967 high made the pair re-test the mentioned MA, which seems currently providing immediate support, together with 23.6% Fibo of its April – August rally, near 2.0300 mark. Expecting another bounce from the 2.0300 level, the pair is expected to initially test 2.0520 and the 2.0600 resistances prior to targeting the August highs. Moreover, a sustained break of which could make the pair run towards 100% FE of its November 2013 to February 2015 up-move, near 2.1100 – 2.1120 area. On the downside close below 2.0300 mark is likely extending the current pullbacks to 61.8% FE, near 1.9980, followed by the 38.2% Fibo, near 1.9900 round figure mark. Should it manage to close below 1.9900, the 100-day SMA, near 1.9700 and the 50% Fibo, near 1.9550-40, are likely consecutive supports during the pair’s decline, breaking which the pair becomes vulnerable to plunge towards 61.8% Fibo, near 1.9200 mark.
CADJPY
Bouncing from its August lows, near 87.30, the CADJPY seems trading in a well-established symmetrical triangle formation, with 92.00 being resistance at present and 89.50 acting as a strong support. Though, failure to break the 92.00, coupled with JPY strength, favors the pair’s downside towards 88.70 and eventually to the August lows of 87.30. Should the pair continue extending declines below 87.30, 61.8% FE of its July – August decline, near 86.00 round figure mark, can provide strong support to limit further southward trading by the pair. However, pair’s ability to break 92.00 can quickly make it capable to rally towards 38.2% Fibo, near 92.60 and then to the 94.00 horizontal mark that acts as a strong support-turned-resistance. Moreover, the pair’s ability to break 94.00 on a closing basis, also surpassing 50% Fibo, near 94.25, can fuel it to 96.00 mark, as indicated by the 61.8% Fibo.
CADCHF
Even if the CADCHF managed to bounce from its August lows, near 0.6970, the four month old descending trend-line, coupled with 100-day SMA, could continue restricting the pair’s near-term advance near 0.7480; though, 50% Fibo of its January – February advance, near 0.7425, can act as immediate resistance. Meanwhile, 61.8% Fibo, near 0.7300 round figure mark is likely immediate support for the pair prior to its plunge to 0.7200 mark. Should the pair stretches the decline below 0.7200, the 76.4% Fibo, near 0.7150, is likely intermediate support before the pair can aim to break 0.7000 mark and re-test August lows. Alternatively, a break above 0.7480, can quickly fuel the pair towards 0.7585 – 0.7600 multiple resistance area, breaking which 0.7750 and the 0.7850 are likely consecutive resistances that the pair could witness during its upward trajectory.
Follow me on twitter to discuss latest markets events @Fx_Anil
About the Author
Anil Panchalauthor
An MBA (Finance) degree holder with more than five years of experience in tracking the global Forex market. His expertise lies in fundamental analysis but he does not give up on technical aspects in order to identify profitable trade opportunities.


Advertisement