

EURCHF On daily chart the pair has decisively weakened below 1.0380-70 support area, marking a short-term ascending trend-line also constituting towards
EURCHF

On daily chart the pair has decisively weakened below 1.0380-70 support area, marking a short-term ascending trend-line also constituting towards formation of a symmetrical triangle. Break below the symmetrical triangular formation suggests resumption of the prior weakening trend and hence from current levels, the pair seems vulnerable to continue drifting lower towards testing 1.0250 support area, representing 23.6% Fib. retracement level of the fall on the SNB surprise decision. Meanwhile on the upside, support symmetrical triangle support break point, 1.0370-80 zone, now seems to provide immediate resistance. This is closely followed by resistance near 1.0420-30 area, marking extension of the upper descending trend-line of the triangle. A decisive move above this trend-line resistance is likely to be followed by a further near-term up-move towards 38.2% Fib. retracement level resistance, near 1.0580-1.0600 region.
NZDCHF
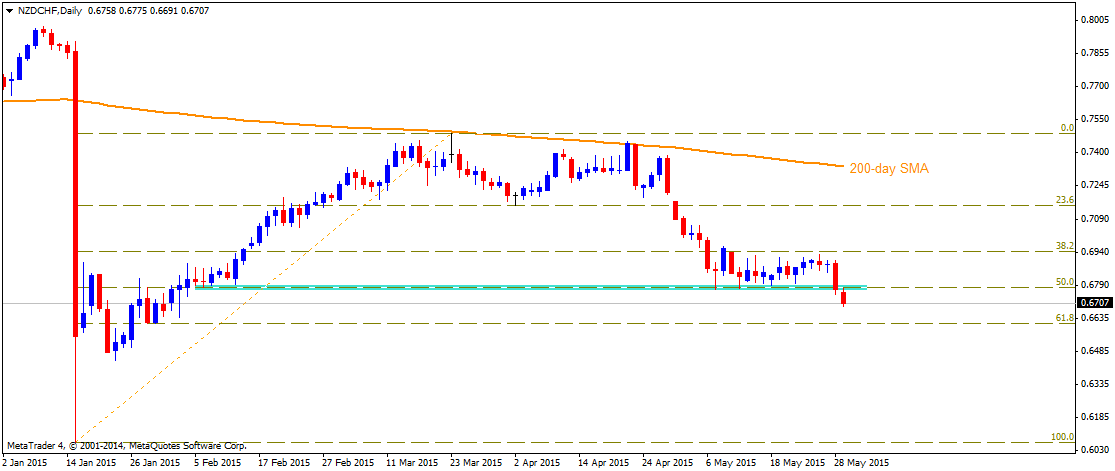
Reversal from 200-day extended further with the pair now breaking below and important support near 0.6770 level, also coinciding with 50% Fib. retracement level of the post SNB recovery move. From current levels the pair seems more likely to continue drifting lower towards 0.6610-0.6600 support, marked by 61.8% Fib. retracement level. On the upside, 50% Fib. retracement level might now act as immediate resistance and any up-move beyond this immediate resistance might now be capped at 38.2% Fib. retracement level resistance near 0.6950 level. Only a break below this strong resistance might negate the near-term bearish outlook. The pair then might attempt to reclaim 0.7000 psychological mark and aim towards testing its next resistance near 0.7070 horizontal area.
NZDJPY
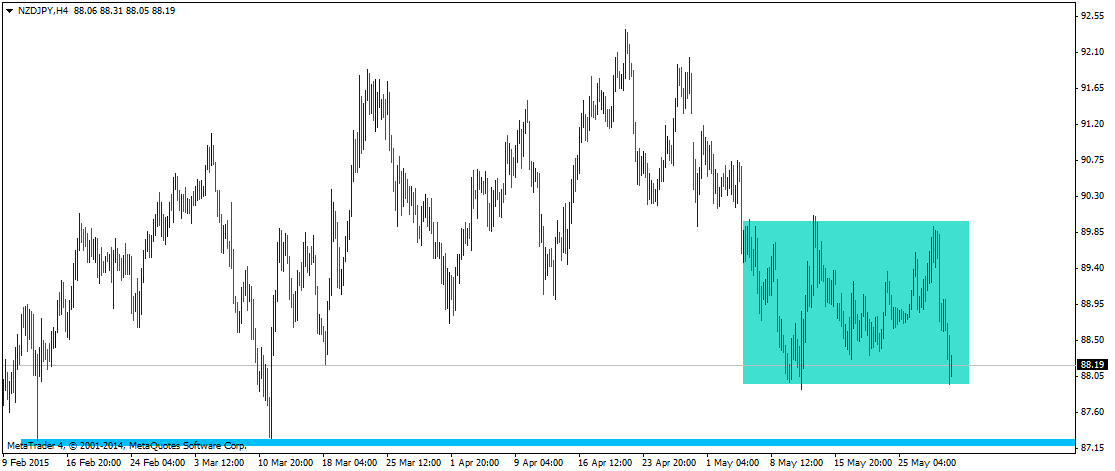
Continuing with its recent range-bound moves, the pair once again reversed from an important resistance confluence near 89.30-50, comprising of 200-day SMA, 100-day SMA and 38.2% Fib. retracement level of Feb. to April 2015 up-swing. The pair is currently holding above 88.00 mark, close to the lower end of the trading range. Should the pair fail to hold 88.00 mark support, breaking below the trading range, it could immediately drop towards testing its next important support near 87.20-87.00 area, also coinciding with 61.8% Fib. retracement level. Alternatively, a bounce from current support level is likely to confront immediate resistance near 88.60 area, which if conquered might lift the pair back towards the top end of the trading range resistance near 89.30-50 area. Unless the pair decisively breaks below 88.00 support or manages to conquer 89.50 resistance, it is likely to continue oscillating in the defined trading range.
Follow me on twitter @Fx_Haresh for latest market updates


