Advertisement
Advertisement
Technical Outlook: EUR/USD, GBP/USD, NZD/USD And USD/CHF
By:
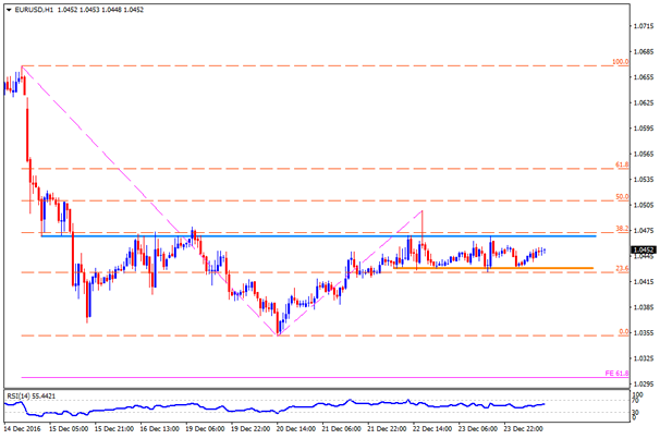
EUR/USD Holiday season mood can be observed when pairs like EURUSD keep maintaining a small rectangle formation for more than a day or two. The pair has
EUR/USD
Holiday season mood can be observed when pairs like EURUSD keep maintaining a small rectangle formation for more than a day or two. The pair has been trading in a 1.0430 – 1.0470 area since last Thursday with brighter chances of upbeat US details to fetch the quote towards 1.0400 and the 1.0380 supports on the downside break prior to revisiting 1.0350 support-mark. Given prices break 1.0350, 61.8% FE level of 1.0300 and the 1.0280 support numbers can quickly be seen on the chart. On the upside, break of 1.0470 may have to confront with 1.0500 and then to 1.0530-35 prior to aiming 1.0600 round figure. In case if bulls propel pair beyond 1.0600, traders may target 1.0670 and the 1.0700 as following resistances.
GBP/USD
In case of GBPUSD, the pair did drop after breaking nearly two-month old ascending trend-line support. The quote presently rests around 1.2240-50 horizontal support but oversold RSI indicate signals for its pullback to 1.2370 and then to 50-day SMA level of 1.2425. Should the pair manage to clear 50-day SMA, it may extend its pullback recovery towards 38.2% Fibonacci Retracement of its September – October dip, at 1.2500, before aiming 1.2550, which if broken opens the door for pair’s advances to 1.2620. Meanwhile, pair’s daily closing below 1.2240 raises the case for its further declines to 1.2165, 1.2100 and to the 1.2085 support levels. Should there be additional downside by the pair below 1.2085, the October lows of 1.1915 might offer an intermediate halt prior to fetching it to 61.8% FE level of 1.1830.
NZD/USD
NZDUSD failed to sustain its bounce from four-month old descending trend-line support and is likely to visit 0.6845-55 area soon. Though, the same is less likely to be broken during the present week, unless any big gains of USD, which in-turn favors another bounce of the pair towards 0.6900 and the 0.6925 resistances prior to challenging 0.6960-65 region. If prices surpass 0.6965, 61.8% Fibonacci Retracement of May – September upside, at 0.6985, and the 0.7000 psychological magnet can come-back on the chart. In an alternative case, when the pair drops below 0.6845, the 0.6780 and the 0.6755 can become imminent while its further declines can please Bears with 0.6675 mark, the May month low.
USD/CHF
Even after failing to sustain its break above November 2015 high, the USDCHF’s bounce from 1.0215 favor pair’s another attempt to break the same 1.0330-40 zone and head towards an upward slanting trend-line resistance of 1.0400. Although overbought RSI indicate a pullback around then, pair’s successful break of 1.0400 enables it to aim for 1.0430 and the 1.0500 resistance figures. On the flipside, 1.0215 and the ascending trend-line support of 1.0190 can offer immediate support to prices before traders can foresee 1.0120 and the 1.0100 downside numbers. If at all the quote declines below 1.0100, 50-day SMA level of 1.0035 becomes a crucial level to watch, which if broken might result flashing 0.9950 support-mark.
Cheers and Safe Trading,
Anil Panchal
About the Author
Anil Panchalauthor
An MBA (Finance) degree holder with more than five years of experience in tracking the global Forex market. His expertise lies in fundamental analysis but he does not give up on technical aspects in order to identify profitable trade opportunities.
Advertisement
