



GOLD
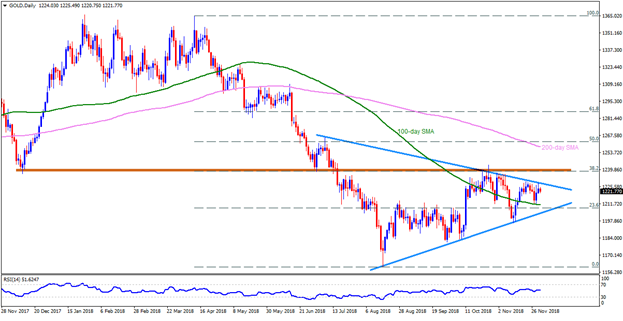
With the resistance-line of near-term symmetrical triangle restricting Gold’s repeated upside attempts, the $1217.50 and 100-day SMA level of $1211.00 may come back on the chart; though, formation-support, around $1203 can limit the quote’s additional declines. Should the Bullion drops beneath $1203 on a daily closing basis, the $1200, the $1195 and the $1188 are likely following numbers to flash on sellers’ radar. Alternatively, a daily break above $1230 trend-line mark could escalate the yellow-metal’s recovery to $1238-40 resistance-region, which if broken might please buyers with $1250 round-figure but $1259, including 200-day SMA, seems a tough challenge for them afterwards. Assuming the metal’s rise past-$1259, the $1265 & $1278 may gain market attention.

SILVER
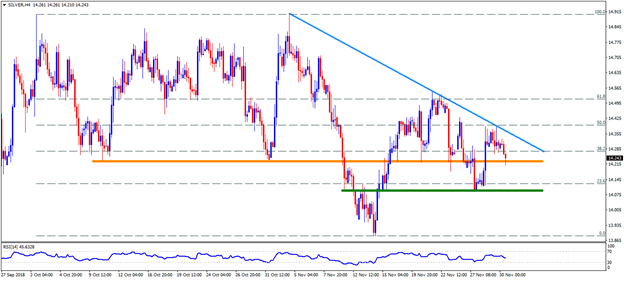
Silver is also witnessing trend-line hurdle to north and is testing the $14.25-20 support-zone, breaking which $14.10-05 and the $13.95 can grab the limelight. Given the white-metal keep trading southwards beneath $13.95, the $13.85 and the $13.60 might become Bears’ favorites. Meanwhile, upside break of $14.40 could propel prices to $14.55-60 resistance-zone. In case Bulls refrain to respect $14.60, the $14.80, the $14.90 and the $15.00 may lure them.
US Dollar Index [I.USDX]
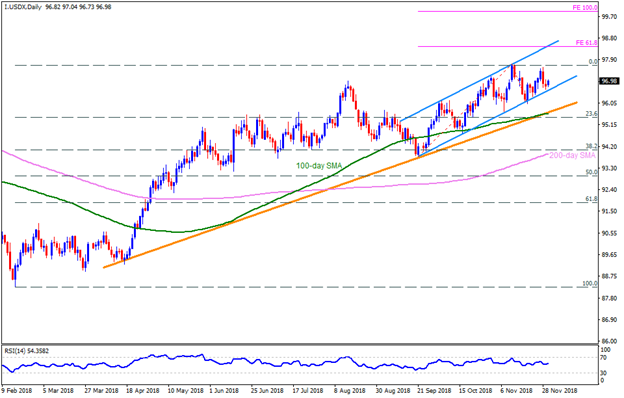
Two-month old ascending trend-channel portrays the US Dollar Index strength to again confront the 97.10 & 97.70 resistances but 61.8% FE level of its recent pullback and upper-line of the said channel, at 98.50 now, could confine the gauge’s further advances. Given the greenback strength fuel the index beyond 98.50, the 99.00 & 100% FE level of 100.00 psychological magnet may appear in demand. On the downside, channel-support of 96.50 and the 96.00 can act as adjacent rests before highlighting the 95.65-60 support-confluence, encompassing 100-day SMA & an upward slanting TL. It should also be noted that a D1 close below 95.60 might not hesitate fetching the quote to the 95.00, the 94.40 and the 200-day SMA level of 93.90 consecutive supports.



