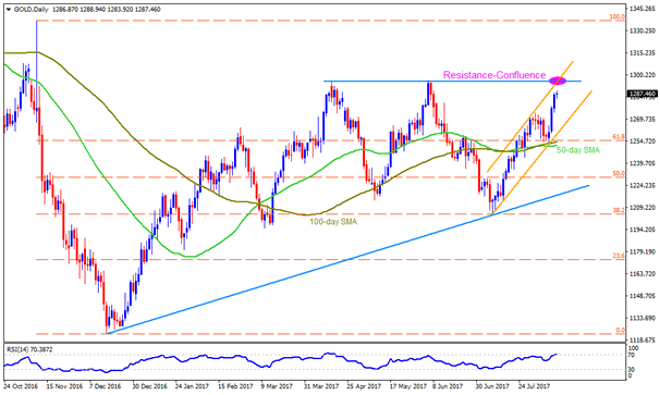
GOLD Although present run for risk-safety helps Gold prices to meet more than two-month high, the $1295-96 confluence-region, comprising resistance-line
Although present run for risk-safety helps Gold prices to meet more than two-month high, the $1295-96 confluence-region, comprising resistance-line of a short-term ascending trend-channel and a horizontal-line that formed double-tops earlier, could restrict the Bullions additional advances. Incase if the quote refrains to respect the $1296 mark, the $1308, the $1311 and the $1321 may offer intermediate halts during its north-run towards November 2016 high around $1338. Should overbought RSI play its role in pulling the metal back, $1277, $1273 & $1268 are likely nearby supports to appear on the chart. However, the precious-metal’s following drop might find it difficult to break channel-support of $1259 which is near to 100-day SMA level of $1254 & 50-day SMA level of $1251. If at all Bears dominate after $1251 break, the $1235 & $1229-28 may flash in their radar.
Unlike Gold, which is heading to its next resistance, the Silver has already cleared 200-day SMA on a daily closing basis, which in-turn favors its upside towards $17.30 and then to the $17.50 before confronting the $17.75 horizontal-line. During the white-metal’s additional rise beyond $17.75, the $18.00 and the $18.25 could act as buffers prior to pushing the buyers to target April high of $18.65. Alternatively, $16.95-90 and $16.65 should be considered as immediate supports for the metal, breaking which $16.35 & $16.00 might please sellers. Given the bullion’s sustained downturn after $16.00, the $15.75 & $15.40 may raise barriers ahead of fetching it to $14.60.
Compared to Gold and Silver, which are rising, the Crude is bearing the burden of its inability to surpass nearly six-month old descending trend-line resistance and is near to test 100-day SMA level of $47.75. However, a seven-week long upward slanting trend-line, at $47.15 now, might restrict its dips afterwards, failing to which can magnify the sellers’ dominance in aiming $46.50 and the $45.75 rest-points. Meanwhile, the energy-vehicle’s bounce from $47.75 can help it revisit $48.70 and then to $49.50 but the aforementioned TL resistance, at $50.00 now, could keep gaining traders attention then after. Should there be an extra buying power that propels oil beyond $50.00 on a daily closing, the $50.40, $50.80 and the $51.65 may entertain traders.
Cheers and Safe Trading,
Anil Panchal
An MBA (Finance) degree holder with more than five years of experience in tracking the global Forex market. His expertise lies in fundamental analysis but he does not give up on technical aspects in order to identify profitable trade opportunities.