
Advertisement
Advertisement
Technical Outlook – US Dollar Index, Gold and Silver
By:
US Dollar Index Having breached the 50-day & 100-day confluence, the US Dollar Index plunged to the lowest levels since June end; however, the 95.10 –
US Dollar Index [I.USDX]
Having breached the 50-day & 100-day confluence, the US Dollar Index plunged to the lowest levels since June end; however, the 95.10 – 95.00 area, encompassing the horizontal support and the seven month old ascending trend-line, could restrict further declines of the index, failing to which, the index could target another horizontal support area, between 93.30-20. Moreover, an extended decline below 93.20 can make the greenback index vulnerable to fill the January gap of 90.50 mark. On the upside, the said confluence of SMAs, between 96.35-50 area, provides immediate resistance to the index, breaking which 97.00 round figure mark and the 98.30 are likely consecutive upside levels that the index watchers should take care of. Should it strengthens above 98.30, the index can initially rally towards 99.00 level prior to targeting the 100.00 – 100.15 horizontal mark.
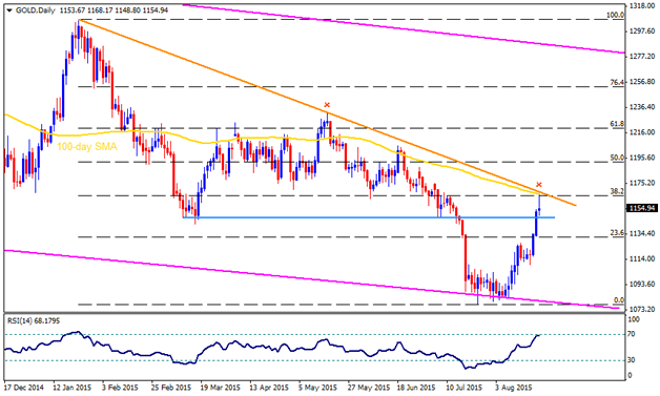
GOLD
Reversal from $1080-70 support region, encompassing the descending trend-channel support on weekly chart, coupled with July lows, fueled the Gold prices to break $1147-48 horizontal mark and test the $1165-68 resistance area, including 100-day SMA, seven month old descending trend-line and the 38.2% Fibonacci Retracement of its January – July decline. Even if the yellow metal show resilience to break the mentioned resistance region, signaling a pull back towards $1147-48 and $1100 round figure mark support, a break of $1100 is likely to sustain below $1070 mark. Should it manage to break $1070, it becomes vulnerable to plunge towards $1000 psychological magnet prior to targeting $980-70 region. On the upside, a close above $1168, also surpassing the $1170, can trigger the metal’s rally towards $1200 round figure mark, breaking which the May month highs, near $1230, are likely intermediate resistance for it prior to witnessing $1255 and the $1280 resistance marks.
SILVER
Alike Gold, bounce in Silver prices from the July lows fueled the white metal towards more than a month’s high; however, $15.700 horizontal mark, quickly followed by the 100-day SMA and the 38.2% Fibonacci Retracement of its January – July decline, near $15.88 – $15.93 region seems restricting the metal’s near-term advance. Should it successfully breaks $15.925, the silver prices can quickly rally to 50% Fibo, near $16.50, prior to targeting $17.00 – $17.10 and the $17.75-85 area. Should the prices start reversing from current levels, which is more likely, $15.20 – $15.00 becomes immediate support before it could test the $14.50 and the July lows near $14.30, breaking which the $14.00 and the $13.50 are likely consecutive supports that the silver prices may target on its continued downtrend.
Follow me on twitter to discuss latest markets events @Fx_Anil
About the Author
Anil Panchalauthor
An MBA (Finance) degree holder with more than five years of experience in tracking the global Forex market. His expertise lies in fundamental analysis but he does not give up on technical aspects in order to identify profitable trade opportunities.


Advertisement