



Dollar Slips on Fresh AI Jitters as Euro Weighs Lagarde’s Early Exit
The dollar eased on Friday as another wave of selling in AI shares drove investors into Treasuries, pulling yields lower, Reuters reported. The euro headed for a monthly loss after a week dominated by central banks and a surprise from the top of the ECB.
Dollar: Safety Flows Cap the Greenback
Even after hot US inflation and growth data, the dollar index slipped to about 101.77 as the 10-year Treasury yield fell to its lowest in more than a month. Yields fall when bond prices rise, so the AI selloff sent money into government debt rather than into dollars. The index is still up about 0.3% for October, a second straight monthly gain.
In Tokyo, the Bank of Japan held rates at 1.25% in an 8-1 vote, raised its inflation forecast and said underlying inflation had reached a level consistent with its 2% target for the first time, CNBC reported. State Street’s Masahiko Loo called it “a boring hold, but an important shift in the Outlook Report,” and expects the next hike around the turn of the year.
Euro: Lagarde to Leave Early
The ECB kept its deposit rate at 2.5% on Thursday, hours after President Christine Lagarde said she will step down on February 7, 2027, nine months before her term ends, because she can no longer “remain neutral.” Lagarde said the Governing Council debated a hike before holding unanimously, and signaled the pause may only last until December. She noted the average eurozone 10-year bond yield has risen about 35 basis points, or 0.35 percentage point, since the September projections, and told high-debt governments to plan for rates staying higher for some time and keep budgets within EU rules, Euronews reported. She avoided naming France, blaming global factors instead.
The euro briefly fell to its lowest since May 2025 on Thursday and is on track for a 1.2% monthly drop, Reuters said, even though the ECB just talked about hiking. That shows the French bond problem and the leadership gap matter more to traders than one extra rate move. Eurozone third-quarter GDP data are due Friday.
EUR/USD Price Forecast
Every new EUR/USD analysis as it publishes, today's technical signal and key levels, live price — on one page.
See all EUR/USD forecastsPound: Budget Clears the Way
Sterling is up about 1% this month against the dollar, Reuters reported. Brown Brothers Harriman called Healey’s Budget neutral for the pound and gilts, saying the added fiscal restraint is too modest to curb the roughly 125 basis points of Bank of England hikes priced over the next year. Société Générale said a hawkish hike on November 5 could add to short covering, meaning traders who bet against the pound buying it back.
US Dollar Index Technical Analysis: DXY Slips Toward 101.54 After 102.48 Rejection
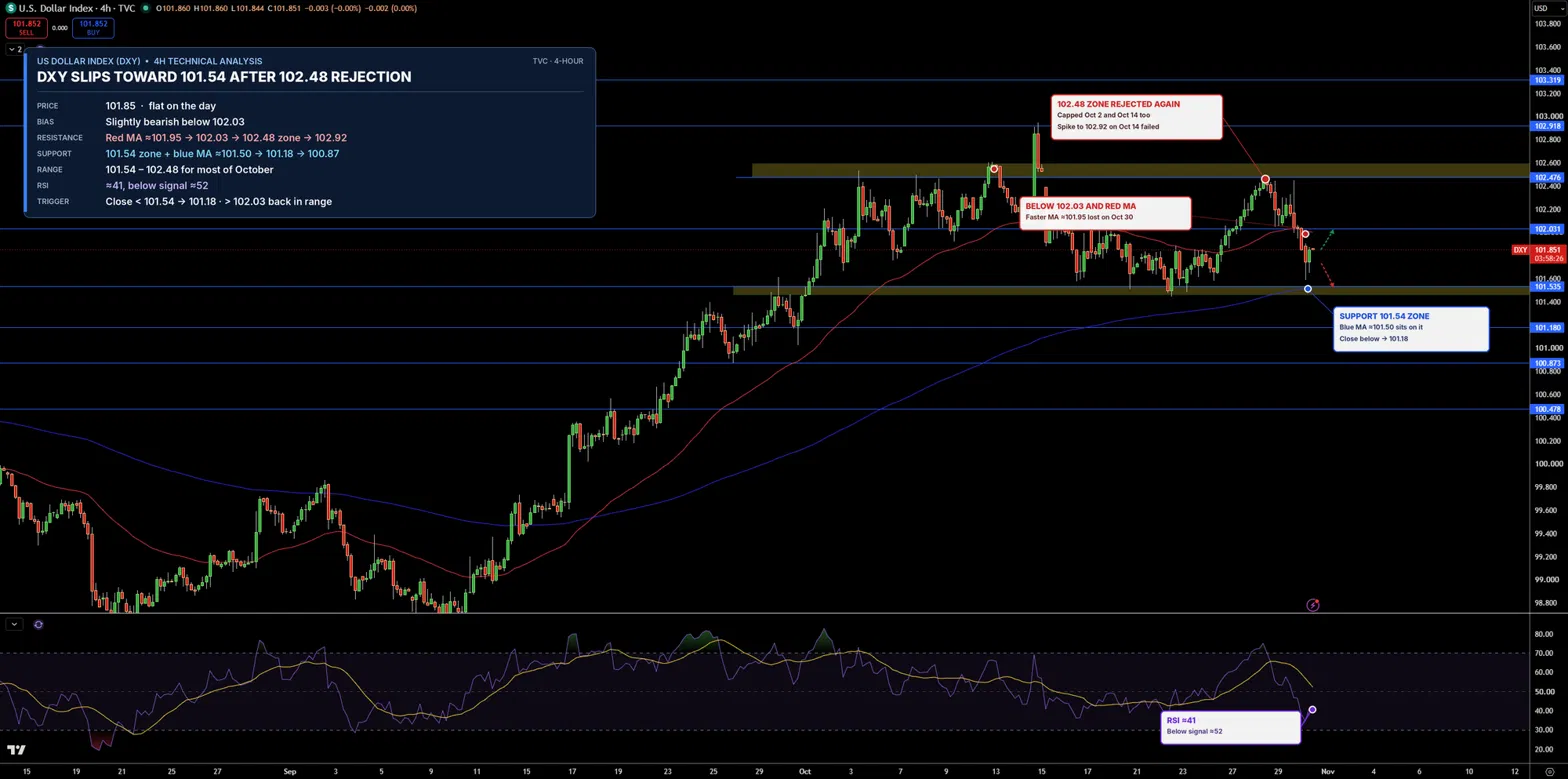
The US Dollar Index is trading near 101.85 on the 4-hour chart. DXY was turned back at the 102.48 zone, a ceiling that also capped it in early October, then dropped below 102.03 and its faster moving average, a line showing the recent average price. The index has moved sideways between 101.54 and 102.48 for most of October.
Support, where buyers tend to step in, is 101.54, then 101.18. Resistance, where sellers tend to step in, is 102.03, then 102.48.
RSI, which measures the strength of recent buying and selling, is near 41 and below its signal line, a slower average of RSI. I keep a slight bearish lean while DXY stays below 102.03. A close below 101.54 would open 101.18.
EUR/USD Technical Analysis: Euro Bounces From 1.1113 as Trendline Caps Gains
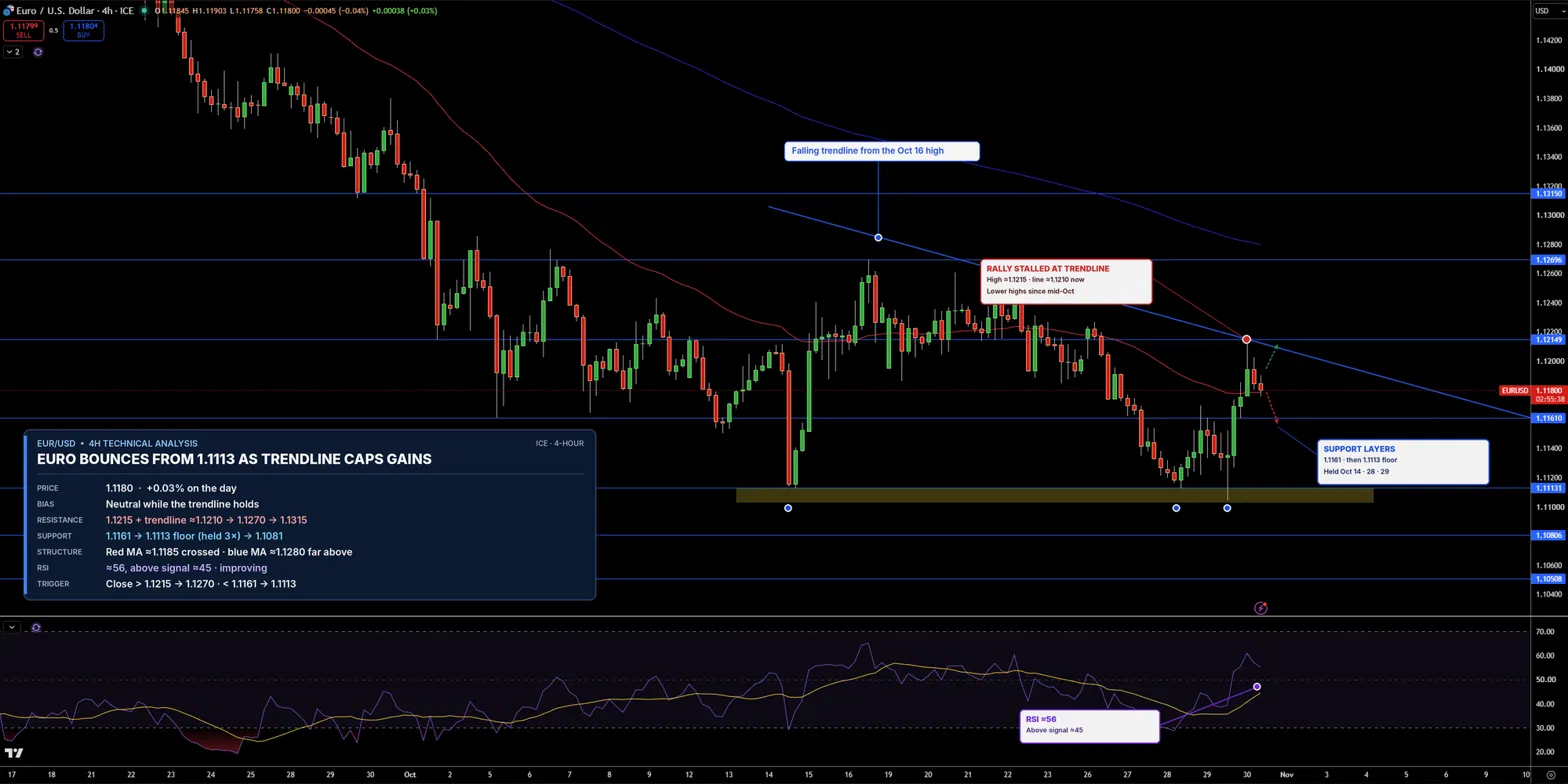
EUR/USD is trading near 1.1180 on the 4-hour chart. Buyers defended the 1.1113 floor for a third time this month, and the pair jumped to about 1.1215. That rally stalled at a falling trendline, a line connecting lower highs since mid-October.
The first resistance is 1.1215, then 1.1270. On the downside, 1.1161 is the first support, followed by 1.1113.
RSI has climbed to about 56 and is above its signal line, so momentum is improving. My bias is neutral while the trendline holds. A close above 1.1215 would open 1.1270, while a drop below 1.1161 would point back to 1.1113.
GBP/USD Technical Analysis: Pound Tests 1.3419 as Triangle Breakout Nears
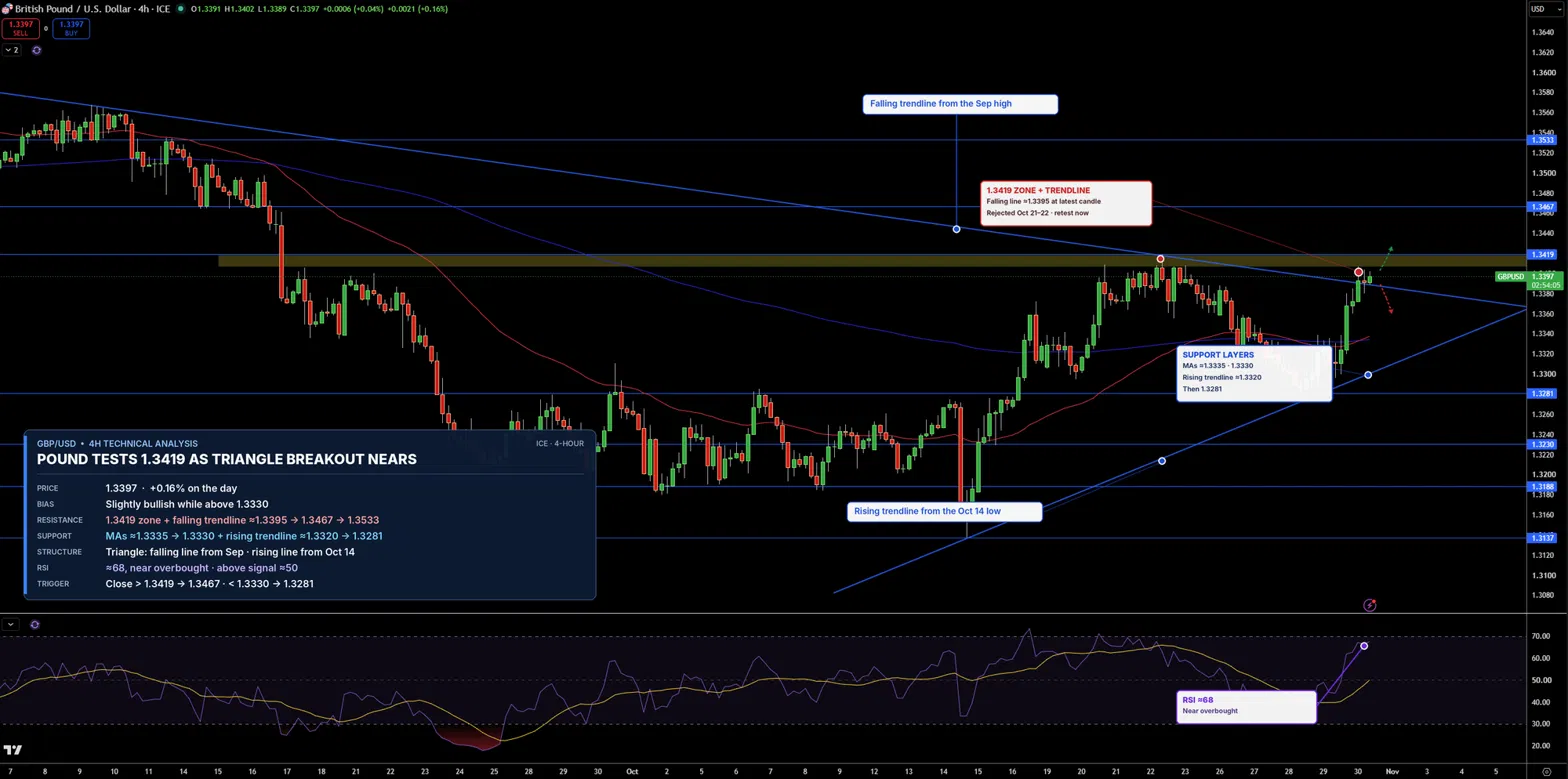
GBP/USD is trading near 1.3397 on the 4-hour chart. The pound has climbed back toward the 1.3419 resistance zone, testing the falling trendline from September near 1.3395. A rising trendline from the October 14 low supports it from below, forming a triangle, a pattern where price swings get smaller before a bigger move.
The first resistance is 1.3419, then 1.3467. Support sits near the moving averages at 1.3335 to 1.3330, followed by the rising trendline near 1.3320 and then 1.3281.
RSI is near 68, close to overbought, meaning prices rose fast. In my view, the pound keeps a slight bullish lean while it holds 1.3330. A close above 1.3419 would open 1.3467.