
Dollar rises on stubborn inflation as Fed keeps rate cuts at bay
The dollar gained against major currencies on 26 May 2026 following a hotter than expected CPI release for April, which reinforced expectations that the Federal Reserve will have to keep a close watch on near term inflation to determine how much progress has been made against its goal. The latest print was driven largely by housing shelter and energy.
Although oil production has resumed in part following the conditional US-Iran ceasefire and the flow of oil from Iran has resumed to some extent through the Strait of Hormuz, the euro was trading with caution amid mixed ECB rhetoric, while the pound was also moving tentatively given the mixed outlook for the UK.
Meanwhile, despite the conditional ceasefire with Iran lowering safe-haven demand for the greenback in recent weeks, today’s CPI print was a reminder for investors to brace themselves for higher rates for longer or at least slower pace of cuts in the Fed’s rate path, with the central bank remaining on a data dependent footing. Markets will continue to pay close attention to the Fed’s rhetoric as the economic data comes in over the next couple of weeks.
On the heels of Trump’s summit with Chinese President Xi Jinping, the US-China trade and technology dispute was only partially addressed to offer some limited risk-off support.

DXY Holds at $99.08, and the Blue Ascending Channel Breakout Is Still Holding
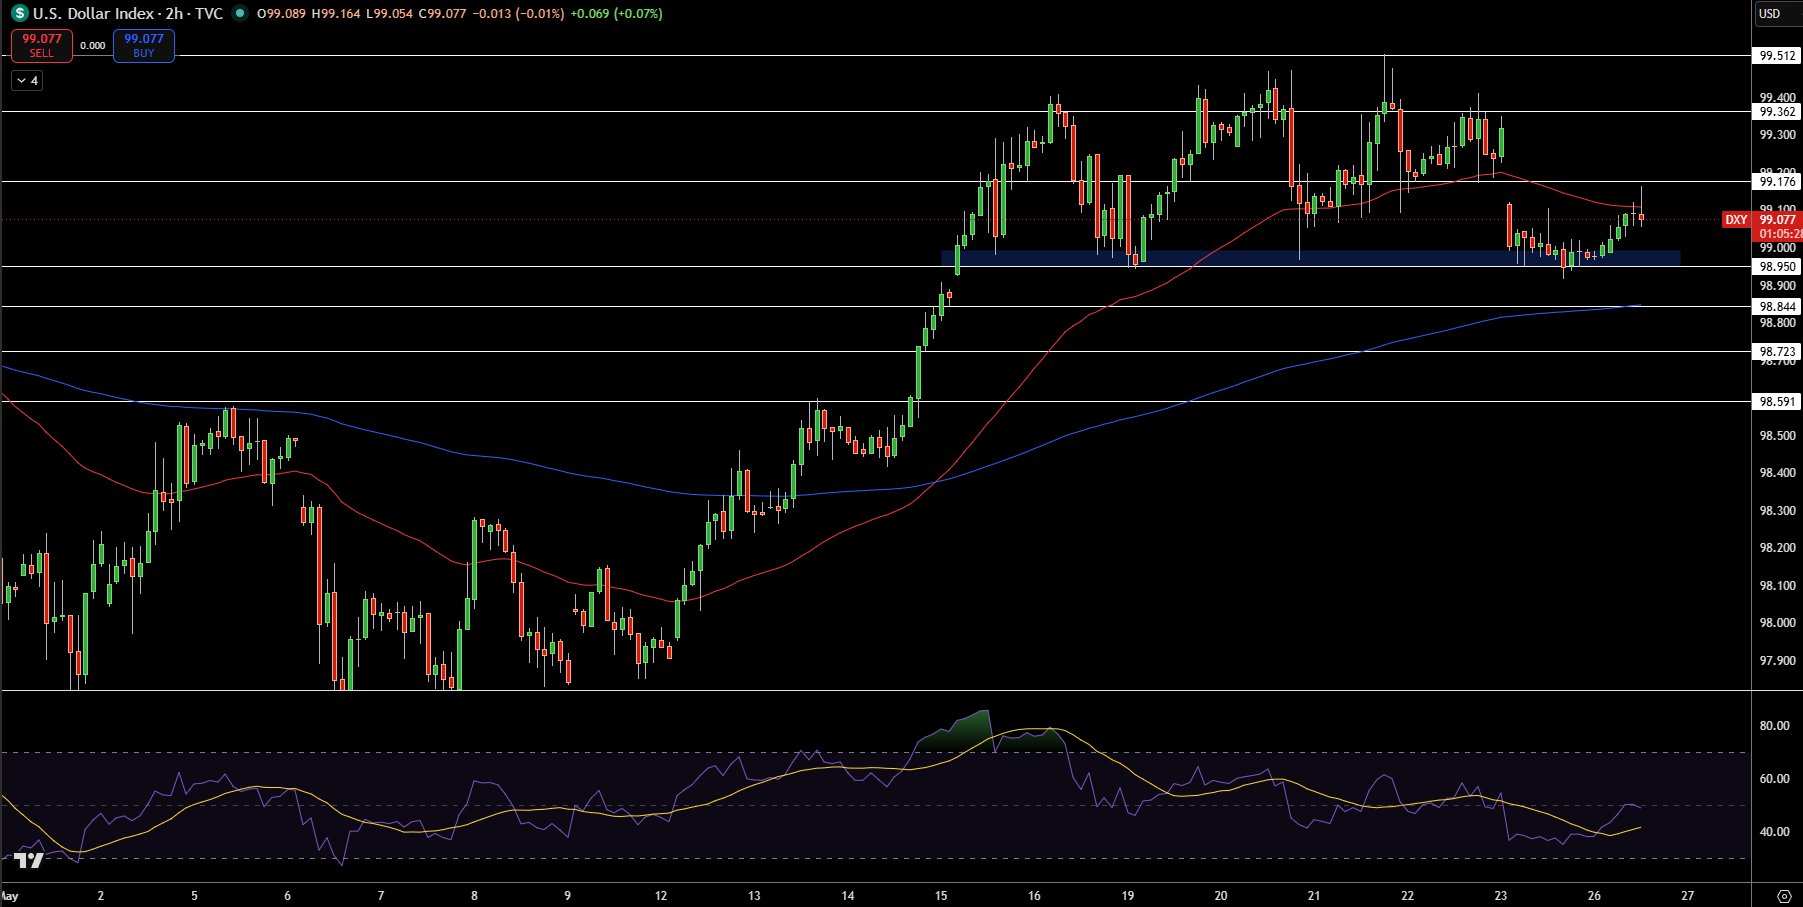
At the moment, DXY is trading at $99.08 on the 2h time frame, with blue ascending channel and red 50 period MA at $98.90 being protected. Green rejection candles printed higher lows above the $99.00 pivot with bullish body and rejection at the white descending trend from April. RSI prints above 52 confirming bullish momentum.
Fib from May shows $99.17 to $99.36 is next resistance. $98.97 acts as a volume profile key support zone. Higher lows are holding the channel breakout toward the next $99.41 to $99.51 resistance zone. Above $98.97 is the current bullish structure zone.
Trade: Buy $99.08; Target $99.36; Stop loss $98.80.
GBP/USD Price Forecast
Every new GBP/USD analysis as it publishes, today's technical signal and key levels, live price — on one page.
See all GBP/USD forecastsGBP/USD Advances to $1.3472, and Rising Channel Is at the Floor
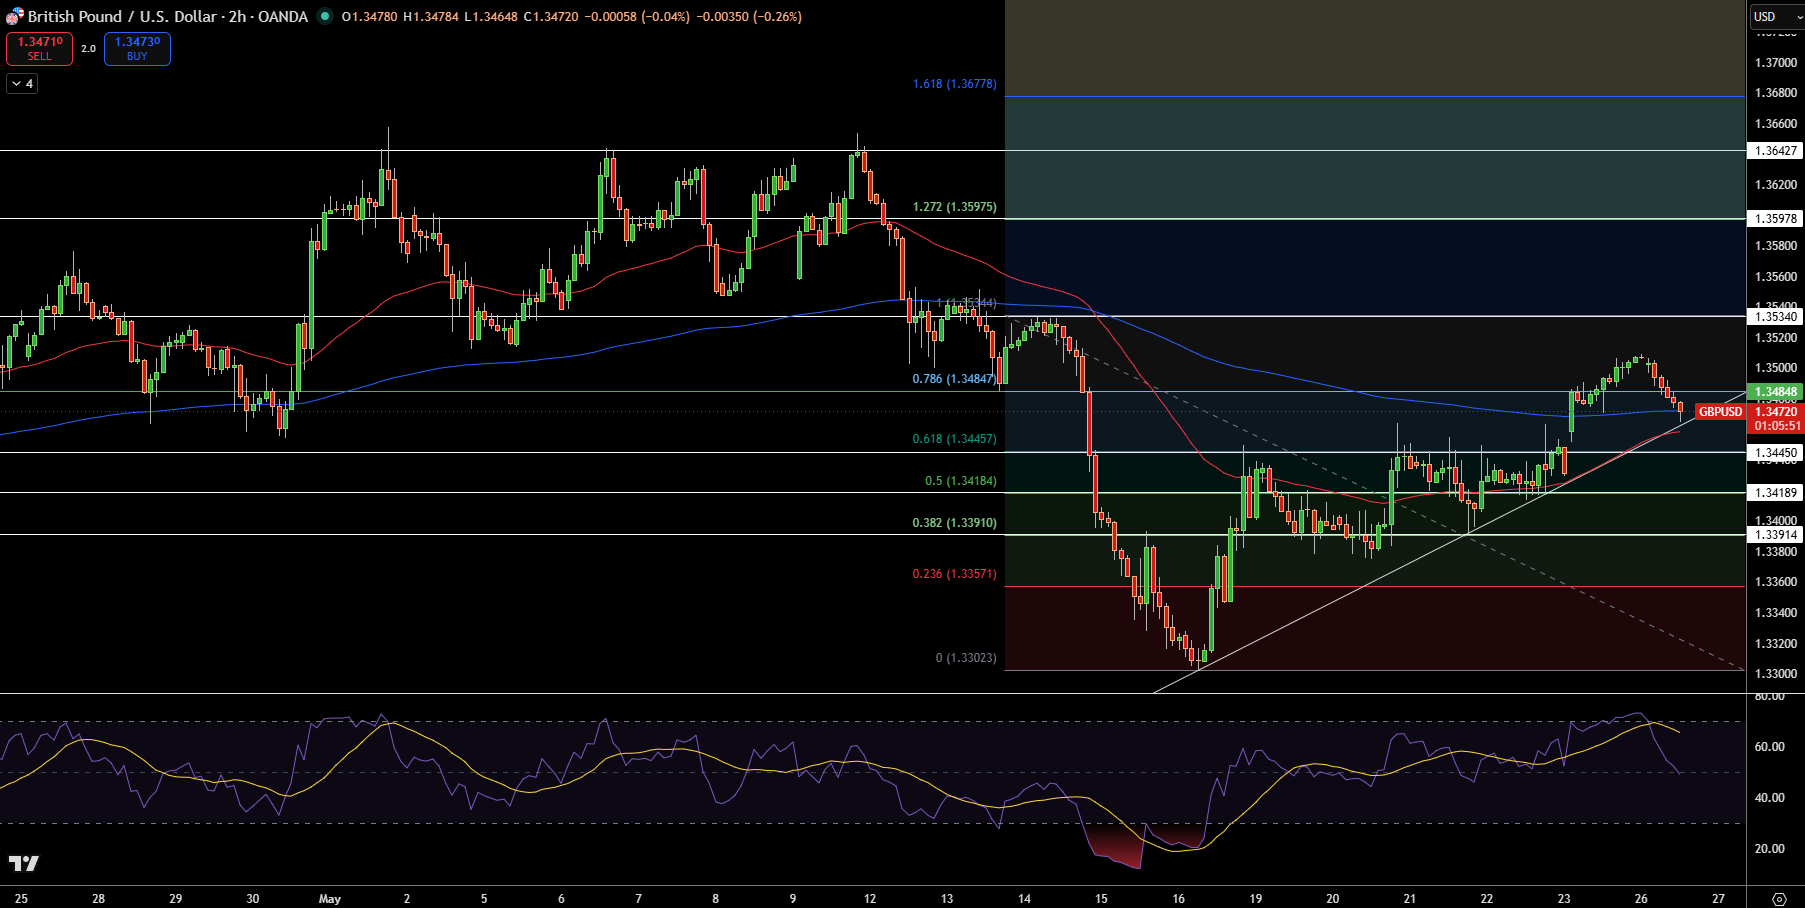
Right now GBP/USD is trading at $1.3472 on the 2h time frame, with green wicks rejected from the white trendline and 0.382 Fib at $1.339 and red 50 MA at $1.345, and the bullish structure holding the channel and higher lows above $1.339.
RSI prints near 52 with neutral momentum. Volume profile pivot at $1.339. Next resistance zone is $1.348 to $1.353. The current bullish structure is above $1.339 as the bullish channel breakout continues.
Trade: Buy $1.3472; Target $1.353; Stop loss $1.339.
EUR/USD Rejects at $1.164, and White Descending Trendline Pressure Is Present
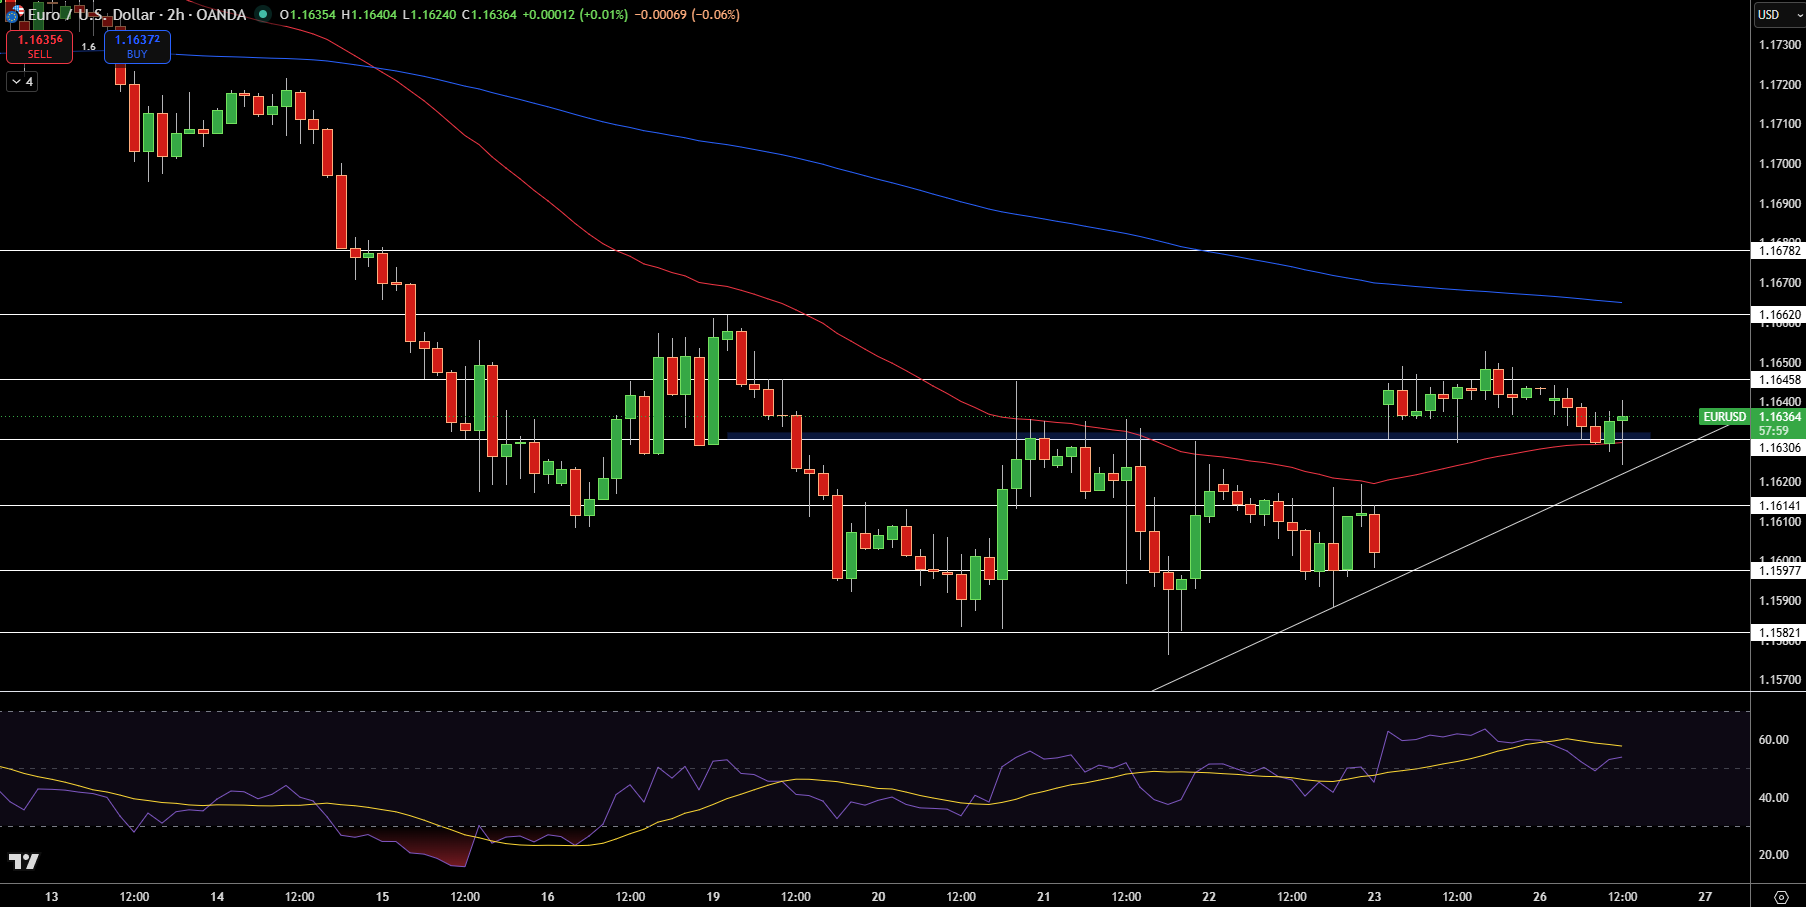
Right now EUR/USD is trading at $1.1604 on the 2h time frame, with red candles failed from the white descending trendline and the MA at $1.166, and the blue ascending trendline from the 2h time frame holds at $1.158. Red wicks printing lower highs while distribution is still above $1.164. RSI prints below 48 confirming fading momentum.
Volume profile key supply zone at $1.162. Next support is $1.158 to $1.156 with fib support. Below $1.166, the structure is weakening while testing the rising channel floor at $1.158. Trade: Sell $1.1604; Target $1.156; Stop loss $1.164.