



Dollar Slips on AI Doubts as UK Inflation Jump Firms Hike Bets
The dollar is losing some support from US tech stocks. The euro remains tied to France’s political crisis, and a hotter UK inflation print has strengthened sterling’s rate story.
Dollar Index: AI Jitters Outweigh Fed Hawkishness
The dollar slipped on Tuesday as doubts about the AI trade resurfaced, Reuters reported. Traders are questioning whether companies can earn enough to justify heavy debt issuance tied to the build-out. Rate expectations are largely unchanged: CME’s FedWatch shows an 83% chance the Fed holds on October 28 and a 94% chance of at least one hike by December. With the Fed meeting on October 28 and the ECB the next day, positioning is likely to stay light this week.
Euro: The French Premium Keeps Widening
The euro rose modestly, but traders remain wary as France faces widespread protests and a deteriorating fiscal outlook. Curfews in riot-hit areas brought some calm, but more demonstrations are planned for the weekend. The gap between French and German 10-year yields has widened to 153 basis points, close to levels last seen during the 2011-2012 debt crisis. A poll taken before the riots already showed Marine Le Pen leading the first round of next year’s presidential election. Handelsbanken’s Tommy von Brömsen said more euro weakness is likely to be priced in.
Pound: Inflation Surprise Backs a November Hike
UK consumer prices rose 3.5% in the 12 months to September, above the 3.4% economists expected and up from 3.1% in August, the ONS said this morning. Motor fuel inflation hit its highest since August 2022, reflecting Britain’s exposure to energy shocks as a net importer. Coming a day after unemployment unexpectedly fell to 4.7%, the data strengthen the case for a Bank of England hike at its November 5 meeting, with the Autumn Budget due on October 28.
US Dollar Index Technical Analysis: DXY Holds 101.73 as Trendline Resistance Is Tested
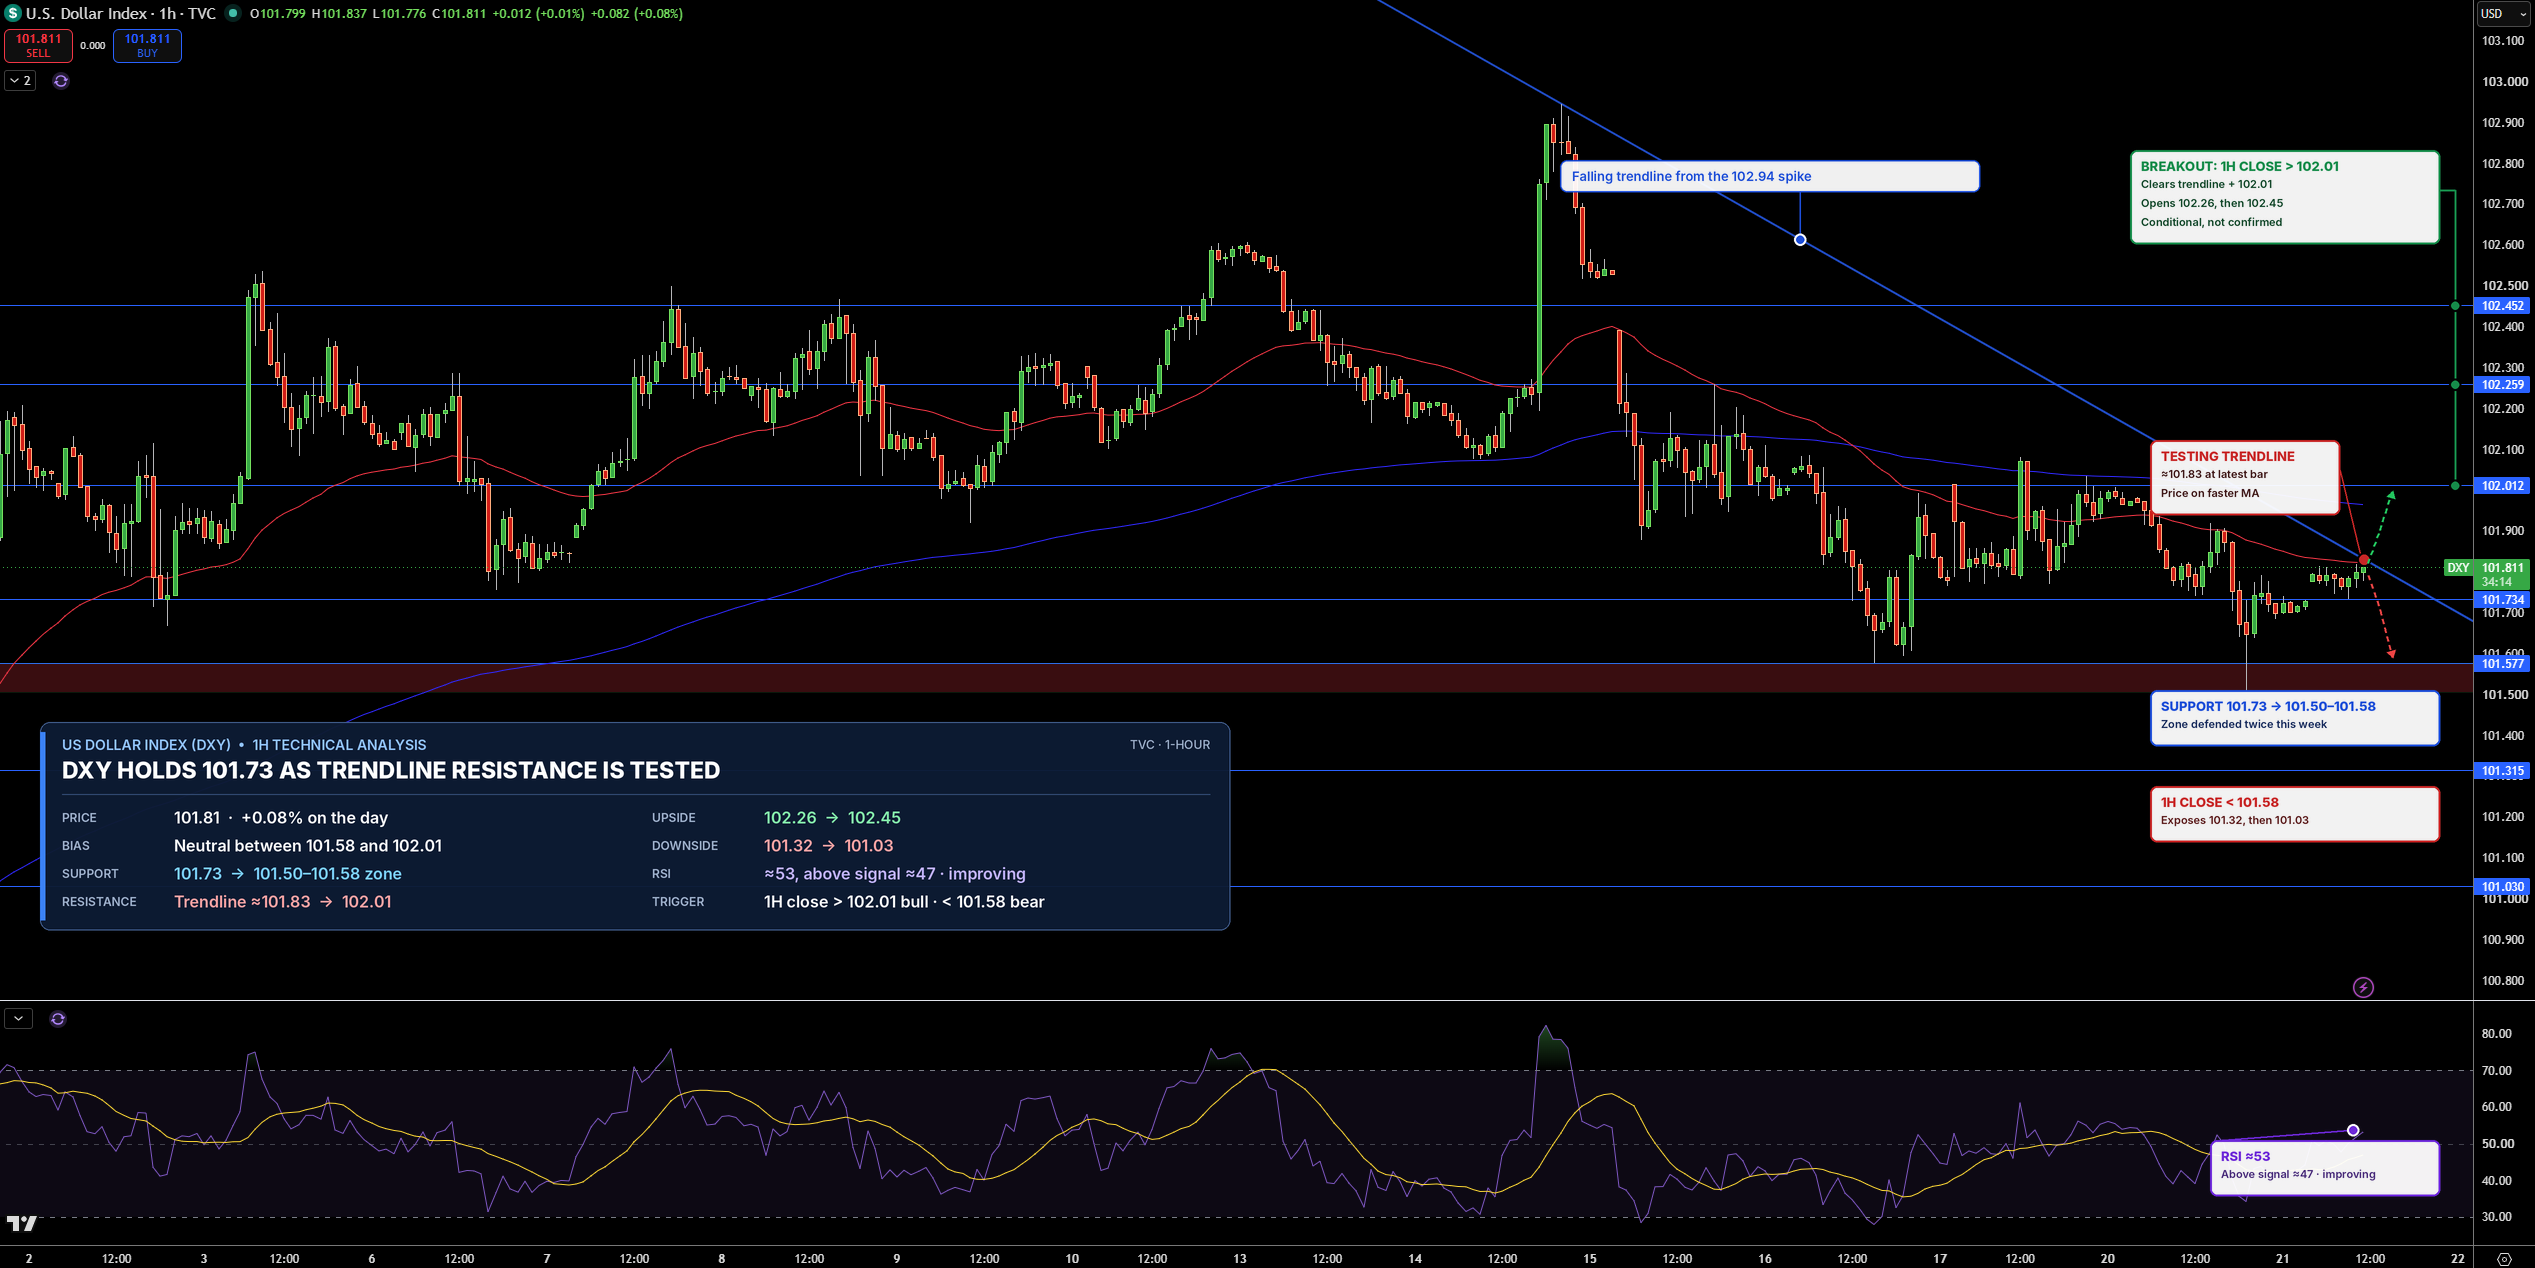
The US Dollar Index is trading near 101.81 on the 1-hour chart. What stands out to me is that DXY is pressing right against the descending trendline that has capped every rally since the 102.94 spike. Sellers still have the broader edge, with a clear run of lower highs. However, buyers have defended the 101.50 to 101.58 support zone twice since last Friday, and price is now sitting on the faster-moving average.
EUR/USD Price Forecast
Every new EUR/USD analysis as it publishes, today's technical signal and key levels, live price — on one page.
See all EUR/USD forecastsThe first resistance I am watching is the trendline, followed by 102.01. A clean break above that area would expose 102.26 and then 102.45. On the downside, 101.73 is the first support, with 101.58 below it. A break of that zone would open the way toward 101.32 and 101.03.
RSI is around 53 and rising above its signal line near 47, suggesting short-term momentum is improving. I am neutral while DXY trades between 101.58 and 102.01. A close above 102.01 would confirm a trendline breakout, while a drop below 101.58 would put sellers back in control.
GBP/USD Technical Analysis: Pound Holds 1.3353 as 1.3404 Breakout Test Continues
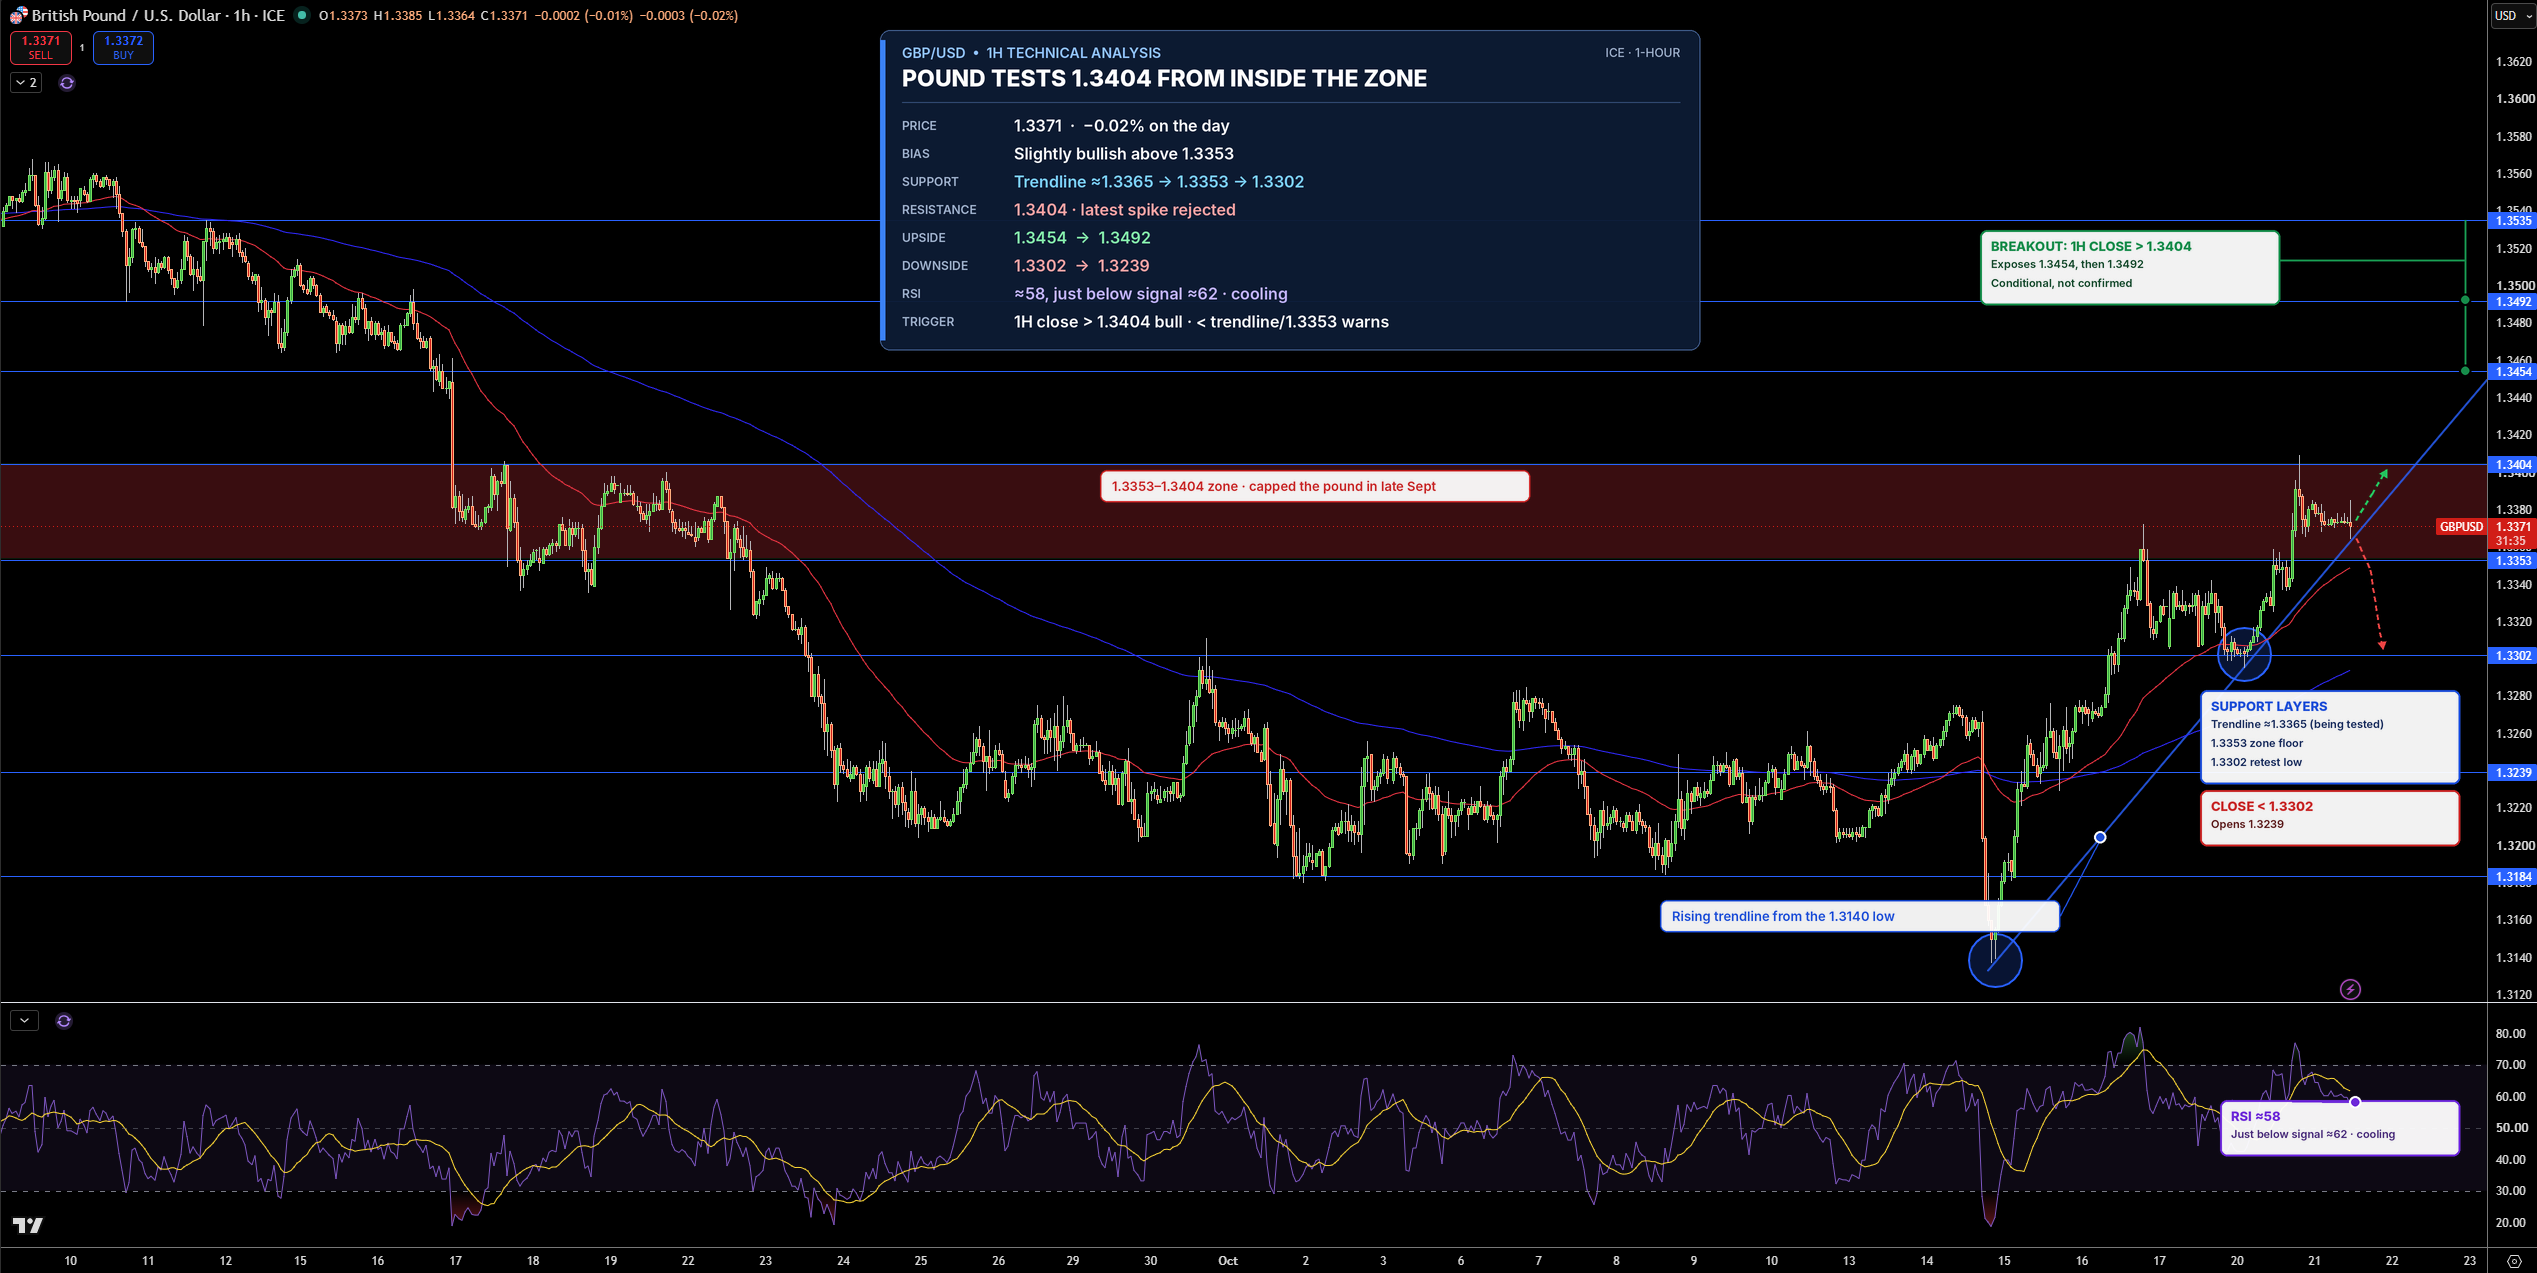
GBP/USD is trading near 1.3371 on the 1-hour chart. The steady recovery from the 1.3140 low, supported by a rising trendline, stands out. The pair cleanly bounced from that line during the retest of 1.3302 earlier this week. Price has now pushed into the 1.3353 to 1.3404 resistance zone, which capped the pound in late September. Both moving averages remain below price and are sloping higher.
The first resistance I am watching is 1.3404, where the latest spike was rejected. A clean break above it would expose 1.3454 and then 1.3492. On the downside, the rising trendline near 1.3365 and 1.3353 form the first support, followed by 1.3302 and 1.3239.
RSI is around 58 and has slipped just below its signal line near 62. That suggests bullish momentum is cooling at resistance but hasn’t reversed. I am leaning slightly bullish as long as GBP/USD holds above 1.3353. A sustained close above 1.3404 would strengthen the breakout case, while a drop below 1.3353 and the rising trendline near 1.3365 would be an early warning. A break below 1.3302 would open 1.3239.
EUR/USD Technical Analysis: Euro Rejected Below 1.1241 as 1.1204 Comes Into Focus
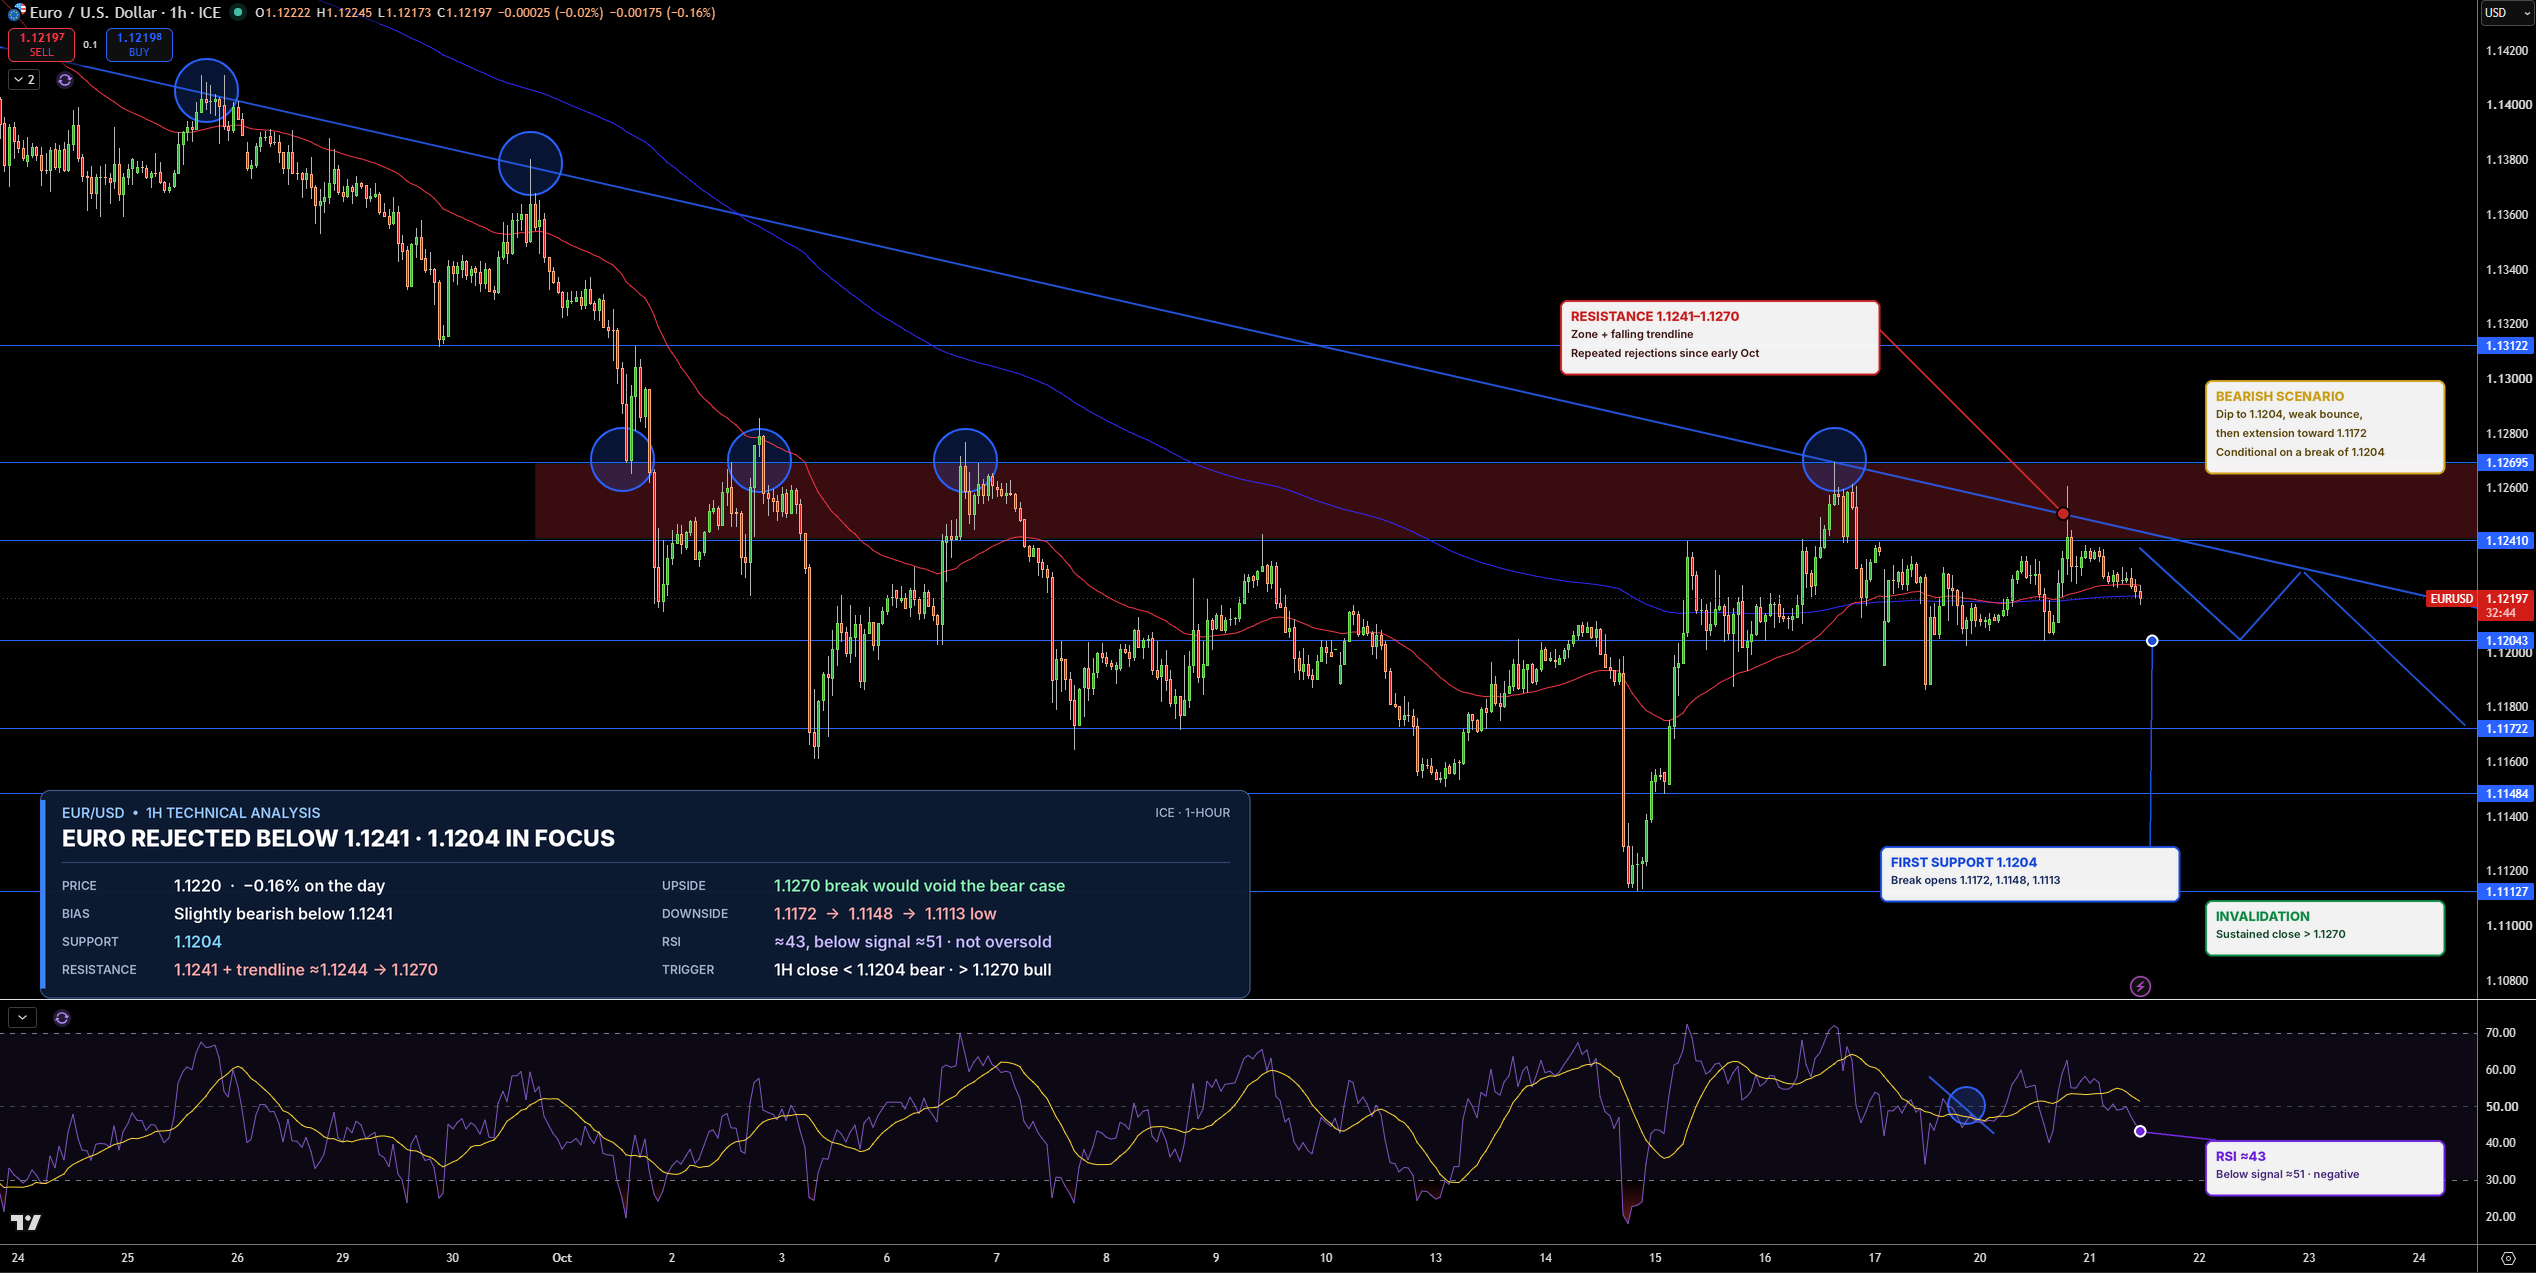
EUR/USD is trading near 1.1220 on the 1-hour chart. What stands out is yet another rejection from the descending trendline and the 1.1241-1.1270 resistance zone. That area has turned buyers away repeatedly since early October. The pair is now slipping below both moving averages. I’d watch for a dip toward 1.1204; a weak bounce from there would keep the bearish case intact, and a break below it would point to 1.1172.
The first support I am watching is 1.1204. A clean break below it would expose 1.1172, then 1.1148, and finally the 1.1113 low. On the upside, 1.1241 and the trendline remain the first hurdle, with 1.1270 as the key ceiling above.
RSI is near 43 and below its signal line around 51, suggesting momentum has turned negative without being oversold. I am leaning slightly bearish as long as EUR/USD stays below 1.1241. A close below 1.1204 would strengthen the downside case, while a sustained break above 1.1270 would invalidate it.